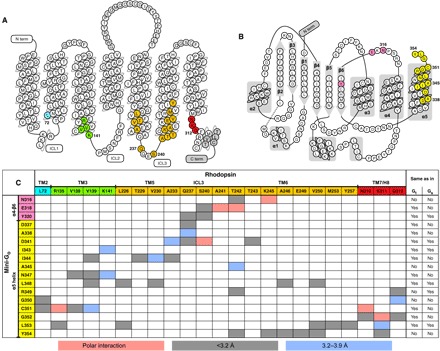
Fig. 2. Contact interface between rhodopsin and mini-Go.

(A) Secondary structure of bovine rhodopsin. Residues that are within 3.9 Å of mini-Go are highlighted in colors matching those in Figs. 1A, 2C, and 4A. The gray regions are not determined in our structure. (B) Secondary structure of mini-Go. Residues that are within 3.9 Å of rhodopsin are highlighted in colors matching those in Figs. 2C and 4A. The dashed line represents the region that is not determined in the structure. (C) Table displaying the residue-residue contacts and distances between rhodopsin and mini-Go; the right two columns show for each residue in mini-Go if the corresponding position in Gtα1 (UniProtKB P04695) and Gsα (UniProtKB P04896) holds the same residue or not. Residue-residue interactions are colored blue (3.2 to 3.9 Å) and gray (shorter than 3.2 Å), while polar interactions are labeled in salmon pink. The rhodopsin and mini-Go models used to calculate the distances contained virtual hydrogen atoms added during structure refinement.
