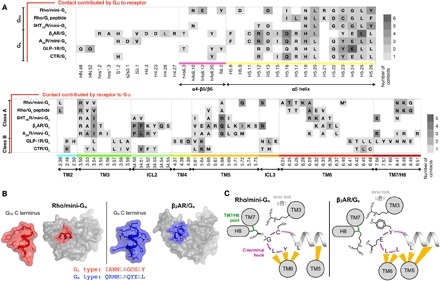
Fig. 4. Comparison between contact interfaces in GPCR–G protein complexes.

(A) Contact regions between receptors and Gα. We compare seven complex structures: rhodopsin/mini-Go, rhodopsin/Gt peptide (PDB ID: 4A4M), 5HT1BR/mini-Go (PDB ID: 6G79), β2AR/Gs (PDB ID: 3SN6), A2AR/mini-Gs (PDB ID: 5G53), glucagon-like peptide 1 receptor (GLP-1R)/Gs (PDB ID: 5VAI), and calcitonin receptor/Gs (PDB ID: 5UZ7). We define contacts if two residues are closer than 4 Å. We color each residue according to the number of residue contacts established with the interacting partner. In the lower panel, M* depicts the stabilizing mutation M257Y in rhodopsin. (B) 3D shape of the last 12 residues of Gα (mini-Go in red and Gs in blue) when bound to active rhodopsin and β2AR (gray surfaces). The sequences of the C-terminal elements are shown below, with conserved residues colored gray. (C) The C-terminal hook is a determinant of GPCR–G protein selectivity. The yellow strokes depict contacts within 4 Å between G protein and receptor.
