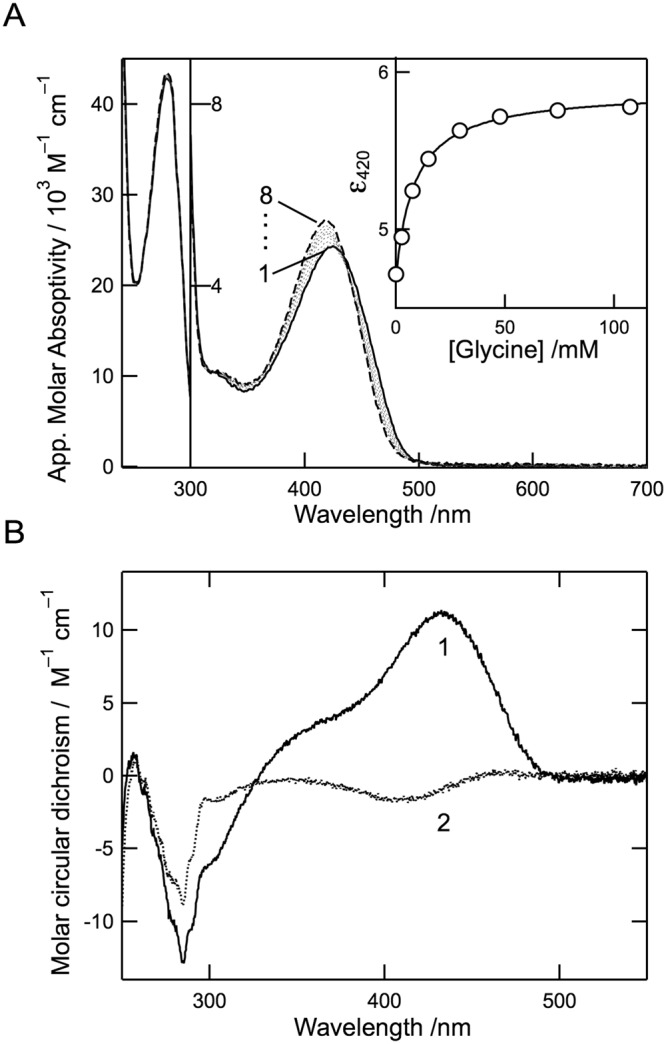
Figure 3.

Spectroscopic characterizations of the PLP form of cALAS. (A) UV/Vis absorption spectra of the PLP form of cALAS (10 μM; based on monomeric state) in the presence of 0, 2.5, 7.4, 15, 29, 48, 74, and 107 mM of glycine (lines 1–8, respectively) at 25 °C. The buffer system was 50 mM HEPES-NaOH (pH 7.5) containing 150 mM KCl and 0.1 mM EDTA. The inset shows a titration curve of the molar extinction coefficient at 422 nm. (B) CD spectra of the PLP form of cALAS in the absence (line 1) and presence (line 2) of 100 mM glycine.
