Figure 5.
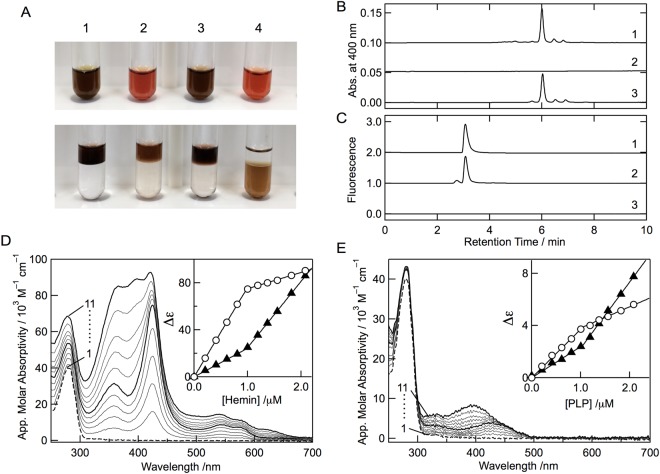
Analysis of chromophores from purified cALAS. (A) Acidic-butanone extraction of the chromophores of hemin (1), the heme form of cALAS (2), equine heart myoglobin (3), and equine heart cytochrome c (4). The solutions are shown before (upper) and after (lower) extraction, respectively. Non-covalently bound heme was extracted into the upper organic layer. (B) HPLC analysis of heme in the acidic-butanone-extracts of hemin (line 1), PLP-bound cALAS (line 2), and heme-bound cALAS (line 3). (C) HPLC analysis of PLP in deproteinized extracts of the PLP control (line 1), PLP-bound cALAS (line 2), and heme-bound cALAS (line 3). (D) Hemin titration of the apoenzyme. Spectral changes of D214A apo-cALAS (1 μM; based on monomeric state) upon addition of hemin. Lines 1–11 correspond to 0, 0.21, 0.41, 0.61, 0.81, 1.00, 1.19, 1.37, 1.56, 1.82, and 2.08 μM hemin, respectively. The inset shows changes in the apparent molecular absorptivity at 425 nm (open circles) and 385 nm (closed triangles) at these concentrations of hemin. (E) PLP titration of the apoenzyme. Spectral changes of D214A apo-cALAS (1 μM; based on monomeric state) upon addition of PLP. Lines 1–11 correspond to 0, 0.21, 0.41, 0.61, 0.81, 1.00, 1.19, 1.37, 1.56, 1.82, and 2.08 μM PLP, respectively. The inset shows changes in the apparent molecular absorptivity at 424 nm (open circles) and 385 nm (closed triangles) at these concentrations of PLP.

