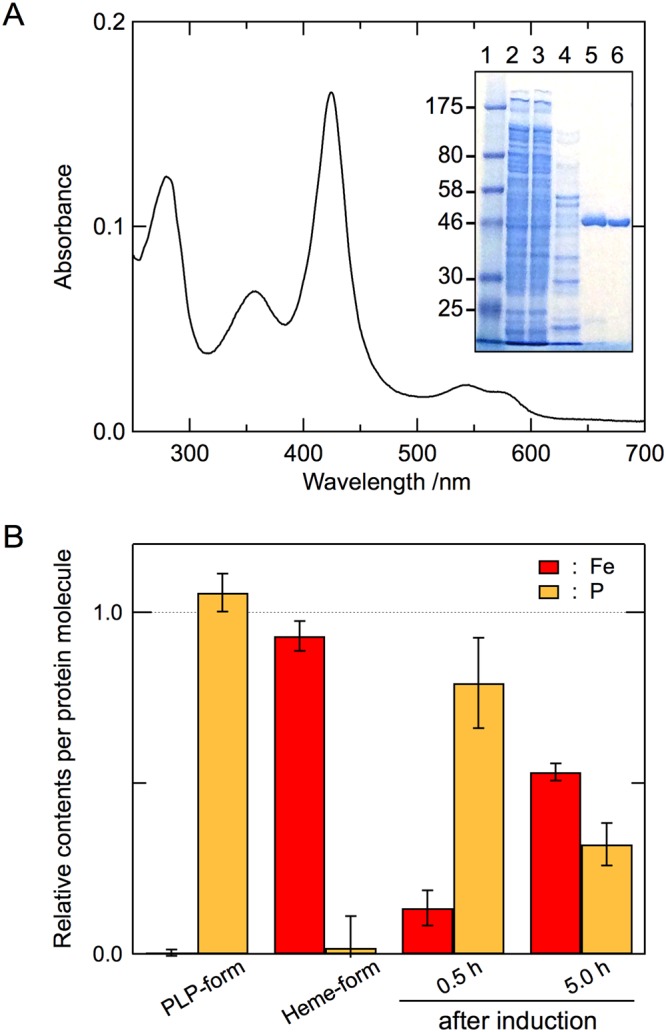
Figure 6.

cALAS expression in C. crescentus. (A) The absorption spectrum of the heme form of cALAS expressed in C. crescentus was measured under the same conditions described in Fig. 4. The inset shows SDS-PAGE at various steps of the purification of cALAS from C. crescentus cells. Lane 1, molecular weight marker (NEB #P7703); lane 2, crude extract of C. crescentus cells expressing His6-tagged cALAS; lane 3, flow-through fraction from the Ni-affinity column; lane 4, wash-out fraction with 60 mM imidazole from the affinity column; lane 5, elution fraction with 200 mM imidazole from the affinity column; lane 6, cALAS eluted from the Mono Q anion exchange column. Samples containing ~1 μg of protein/lane were further analyzed. (B) The contents of iron (derived from heme) and phosphorus (derived from PLP) relative to sulfur (derived from sulfur-containing amino acid residues of cALAS) were analyzed by ICP-AES. Because cALAS contains 20 sulfur-containing amino acid residues (3 cysteines and 17 methionines), 20 μM heme, 20 μM PLP, and 400 μM Cys/Met mixture (3:17 molar ratio) were utilized as the calibration standards for iron, phosphorus, and sulfur. Enzyme preparations were performed in triplicate, and three measurements were carried out for each sample. The experimental errors for each sample were within ±5%. Yellow and red bars show phosphorus and iron, respectively. From left to right, the purified PLP form and heme form expressed in E. coli, and the affinity-purified samples expressed in C. crescentus 30 min and 5 h after induction.
