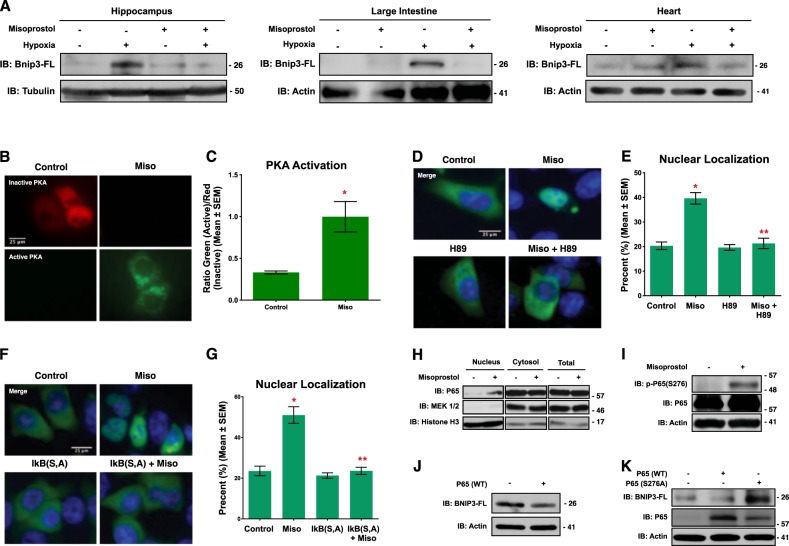
Fig. 1. Misoprostol opposes hypoxia-induced Bnip3-FL expression.
a Immunoblot for Bnip3-FL in protein extracts from the hippocampus, large intestine, and heart of PND10 rat pups exposed to hypoxia (10% O2) ± misoprostol for 7 days. b HCT-116 cells were transfected with PKA biosensor (pPHT-PKA), and treated with 10 μM misoprostol or vehicle for 2 h. Cells were imaged by standard fluorescence microscopy. c Quantification of fluorescent images in b by measuring the ratio of green (active) to red (inactive) fluorescent signal, normalized to cell area, quantified in 10 random fields. d HCT-116 cells were transfected with GFP-P65 (green) and were treated with 10 μM misoprostol ± 10 μM H89 for 20 h. Cells were stained with Hoechst (blue) and imaged by standard fluorescence microscopy. e Quantification of fluorescent images in d by calculating the percentage of cells with nuclear P65 signal over 10 random fields. f HCT-116 cells were transfected with IkBa(SS32,36AA) [indicated as IkB (S, A)] or an empty vector control. GFP-P65 (green) was used to indicate subcellular P65 localization in all conditions. Cells were treated with 10 μM misoprostol or vehicle control for 20 h. Cells were stained with Hoechst (blue) and imaged by standard fluorescence microscopy. g Quantification of fluorescent images in d by calculating the percentage of cells with nuclear P65 signal over 10 random fields. h HCT-116 cells were treated with 10 μM misoprostol or vehicle for 20 h, during extraction proteins were fractioned according to their sub-cellular compartment. Protein extracts were immunoblotted, as indicated. i 3T3 cells were treated with 10 μM misoprostol or vehicle control for 4 h. Protein extracts were immunoblotted as indicated. j HCT-116 cells were transfected with wild-type P65 or empty vector control. Extracts were immunoblotted, as indicated. k HCT-116 cells were transfected with P65 constructs for 20 h. Extracts were immunoblotted, as indicated. Data are represented as mean ± S.E.M. *P < 0.05 compared with control, while **P < 0.05 compared with treatment, determined by 1-way ANOVA or by unpaired t-test

