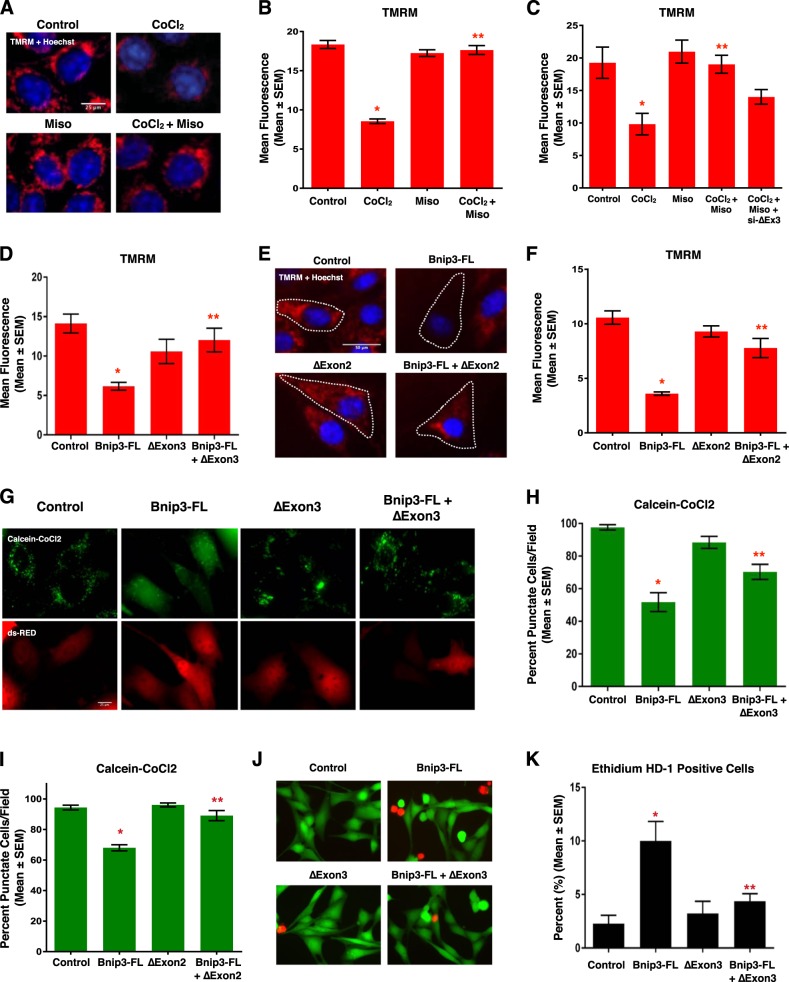
Fig. 5. Bnip3 splice variants oppose mitochondrial perturbations.
a HCT-116 cells treated with 200 μM cobalt chloride ± 10 μM misoprostol or vehicle control for 20 h. Cells were stained with TMRM (red) and Hoechst (blue) and imaged by standard fluorescence microscopy. b Quantification of TMRM in a, red fluorescent signal was normalized to cell area and quantified in 10 random fields. c Quantification of H9c2 cells treated with 200 μM cobalt chloride ± 10 μM misoprostol or vehicle control for 20 h, and transfected with si-Bnip3ΔExon3 or a scrambled control. Cells were stained as in a and quantified as in b. d Quantification of H9c2 cells was transfected with Bnip3-FL, Bnip3ΔExon3, or an empty vector control. TMRM staining was quantified as in b. e H9c2 cells were transfected with Bnip3-FL, BNIP3ΔExon2, or empty vector control. Outlines indicate CMV-GFP positive cells, included to identify transfected cells. Cells were stained as in a. f Quantification of (e), red fluorescent signal was normalized to cell area and quantified in 10 random fields. g H9c2 cells were transfected with Bnip3-FL, Bnip3ΔExon3, or empty vector control. CMV-dsRed (red) was used to identify transfected cells. Cells were stained with calcein-AM and cobalt chloride (CoCl2, 5 μM) to assess permeability transition. h Quantification of g by calculating the percentage of cells with punctate calcein signal in 10 random fields. i Quantification of H9c2 cells transfected with Bnip3-FL, BNIP3ΔExon2, or empty vector control. CMV-dsRed was used to identify transfected cells. Cells were stained and quantified as indicated in h. j H9c2 cells transfected with Bnip3-FL, BNIP3ΔExon3, or empty vector control. Live cells were stained with calcein-AM (green), and necrotic cells were stained with ethidium homodimer-1 (red), cells were imaged by standard fluorescence microscopy. k Fluorescent images in j were quantified by calculating the percent of necrotic cells (ethidium homodimer-1 positive) cells in 10 random fields. Data are represented as mean ± S.E.M. *P < 0.05 compared with control, while **P < 0.05 compared with Bnip3-FL treatment, determined by 1-way ANOVA

