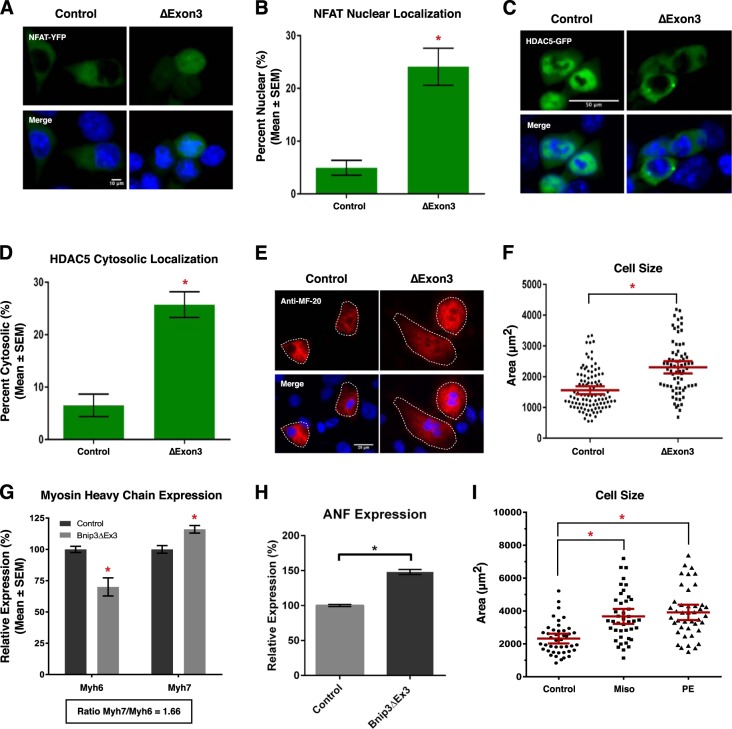
Fig. 8. Bnip3ΔExon3 regulates cardiomyocyte hypertrophy.
a HCT-116 cells were transfected with Bnip3ΔExon3 or an empty vector control. NFAT-YFP (green) was used to indicate subcellular localization of NFAT. Cells were stained with Hoechst (blue) and imaged by standard fluorescence microscopy. b Quantification of fluorescent images in a, by calculating the percentage of cells with nuclear NFAT signal over 10 random fields. c HCT-116 cells were transfected with Bnip3ΔExon3 or an empty vector control. HDAC5-GFP (green) was used to indicate subcellular localization of HDAC5. Cells were stained and imaged as in a. d Quantification of fluorescent images in (c), by calculating the percentage of cells with cytosolic HDAC5 signal over 10 random fields. e Primary ventricular neonatal cardiomyocytes (PVNM) cells were transduced with Bnip3ΔExon3 or control virus. Cells were fixed, stained with Hoechst (blue), and probed for myosin heavy chain (Anti-MF-20, red) expression. f Quantification of e, where cell size (μm2) was calculated based on the area of the red fluorescent signal and quantified in 10 random fields. g, h PVNM cells treated as in e. RNA was isolated and qRT-PCR was performed for myosin heavy chain isoform and ANF expression. i Quantification of PVNM cells treated with 10 μM misoprostol, 10 μM phenylephrine (PE), or vehicle control for 20 h. Cells were stained with calcein-AM (green) and assessed for cell size. Cell size (μm2) was calculated based on the area of the green fluorescent signal and quantified in 10 random fields. Data are represented as mean ± S.E.M. *P < 0.05 compared with control, determined by unpaired t-test

