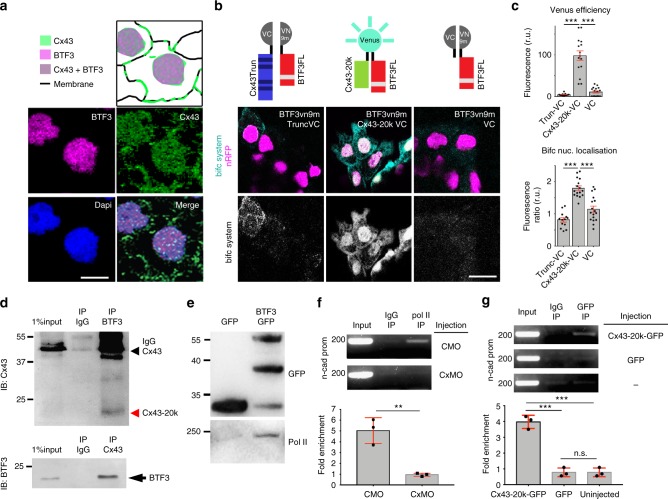
Fig. 10.
Cx43 carboxy-terminal and BTF3 form a transcriptional complex. a Diagram (top) summarizing the localization of BTF3 and Cx43 in the nucleus of st23 neural crest (bottom). Anti-BTF3 (magenta), Anti-Cx43 (green) and DAPI (blue). Scale bar = 15 μm. b Diagrams of the BiFC system. BiFC results showing that BTF3 and Cx43-20k interact in the nucleus of st23 neural crest. VENUS components coexpressed on neural crests. Scale bar = 20 μm. c Intensity of VENUS showing the efficiency of the BiFC system in the different treatments (top) and nucleus to cytosol ratio (bottom) of BiFC signal (nTruncVC = 150, nCx43-20kVC = 147, nVC = 98 cells, N = 3). d Co-immunoprecipitation of BTF3 and Cx43 in HeLa cells (N = 4). e Co-immunoprecipitation showing biochemical interaction between BTF3 and Polymesare II (N = 3). f, g ChIP experiments for n-cad promoter of st23 neural crest as indicated (f: N = 3, g: N = 3). Histograms in c, f, and g represent mean ± SE (one-way ANOVA p < 0. 001, two-tailed t- test p** < 0.01, p*** < 0.001). N number of independent experiments; n sample size. Spread of data in bar charts is shown as overlying dots. n.s. nonsignificant

