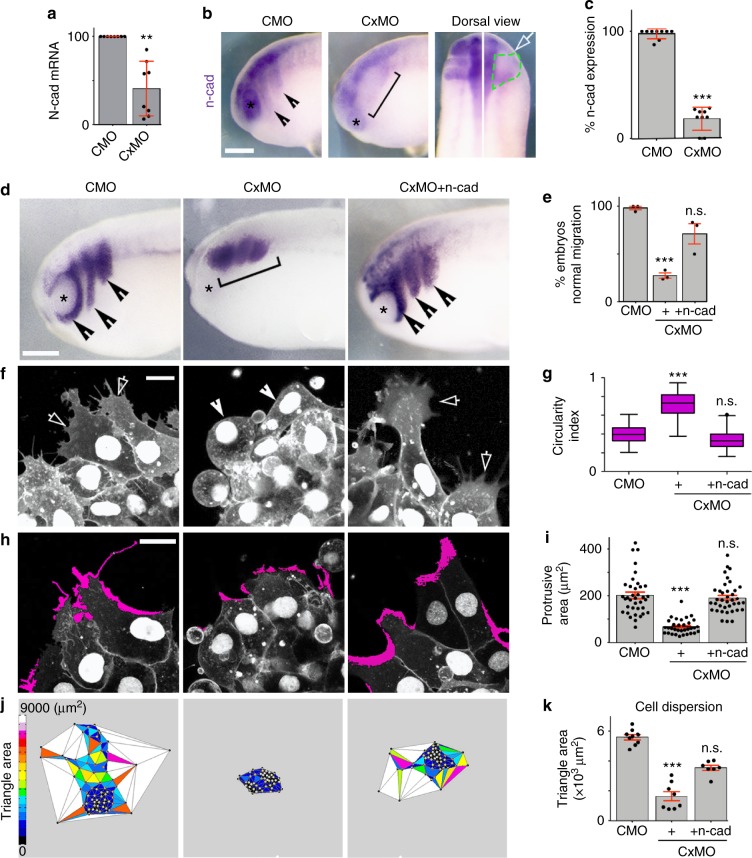
Fig. 2.
Cx43 mediates N-cadherin mRNA expression. a qPCR of n-cad (nCMO = 68, nCxMO = 58 embryos, N = 8). b Lateral and dorsal views of st23 embryo, analyzed by in situ hybridization ISH against n-cad, arrowheads indicate normal and bracket decreased expression, white arrow injected side and green segmented line the NC. c % of n-cad expressing embryos shown in b (nCMO = 178, nCxMO = 187 embryos, N = 9). d St23 embryo showing neural crest migration by ISH for twist; normal (arrow) and impaired (brackets) migration and e % of st23 embryos with normal neural crest migration (nCMO = 89, nCxMO = 105, nCxMO-ncad = 124 embryos, N = 3). Scales bar in b and d = 50 μm. f St23 neural crest cells expressing nRFP + mRFP; normal (arrows) and short protrusions (arrowheads) and g cell morphology quantification (nCMO = 86, nCxMO = 87, nCxMO-ncad = 98 cells, N = 3); Scales bar in f and h = 15 μm. h St23 neural crest cells expressing nRFP + mRFP; in magenta lamellipodia extensions and i quantification of protrusion area, (nCMO = 37, nCx43MO = 33, nCxMO-ncad = 38 cells, N = 3). j Cell dispersion analysis after 6 h of culture using Delauney triangulation and k its quantification (n = 10 NC explants, N = 3). Histograms in a, c, e, i, and k represent mean ± SE (two-tailed t test p** < 0.01, p*** < 0.001). In g box plots show the median, box edges represent the 25th and 75th percentiles, and whiskers show spread of data including outliers (Mann Whitney test p*** < 0.001). N number of independent experiments; n sample size. Spread of data in bar charts is shown as overlying dots. n.s. nonsignificant

