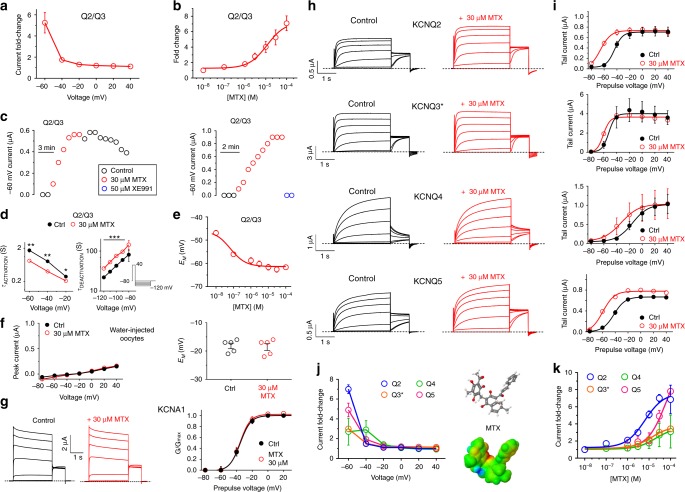
Fig. 2.
MTX preferentially activates KCNQ2. a Voltage dependence of KCNQ2/3 current fold-increase by MTX (30 µM), plotted from traces as in Fig. 1 (n = 9). b Dose response of KCNQ2/3 channels at −60 mV for MTX (calculated EC50 = 11.5 µM; n = 4–9). c Exemplar −60 mV KCNQ2/3 current (left) during wash-in/washout of MTX; right, during wash-in of MTX followed by XE991. d Mean activation (left) and deactivation (right) rates for KCNQ2/3 before (Ctrl) and after wash-in of MTX (n = 9); ***p < 0.001. Activation rate was quantified using voltage protocol as in Fig. 1d. Deactivation rate was quantified using voltage protocol shown (lower right inset). e MTX dose-dependently hyperpolarizes resting membrane potential (EM) of unclamped oocytes expressing KCNQ2/3; n = 9. f MTX has no effect on (left) endogenous mean current or (right) EM of water-injected control oocytes (n = 5). Voltage protocol as in Fig. 1d. g MTX has no effect on (left) averaged current traces or (right) G/Gmax of oocytes expressing KCNA1 (n = 5). Voltage protocol as in Fig. 1d. h Averaged current traces for homomeric KCNQ2–5 channels in the absence (Control) or presence of MTX (30 µM) (n = 5–10). Voltage protocol as in Fig. 1d. i Mean effects of MTX (30 µM) on −30 mV tail currents for channels and voltage protocol as in h (n = 5–10).j. Mean voltage dependence of 30 µM MTX (structure and surface potential, right) activation of homomeric KCNQ2–5 at −60 mV, recorded from tail currents as in i (n = 5–10). k MTX dose response at −60 mV for homomeric KCNQ2–5, quantified from data as in i (n = 5–10). All error bars indicate SEM

