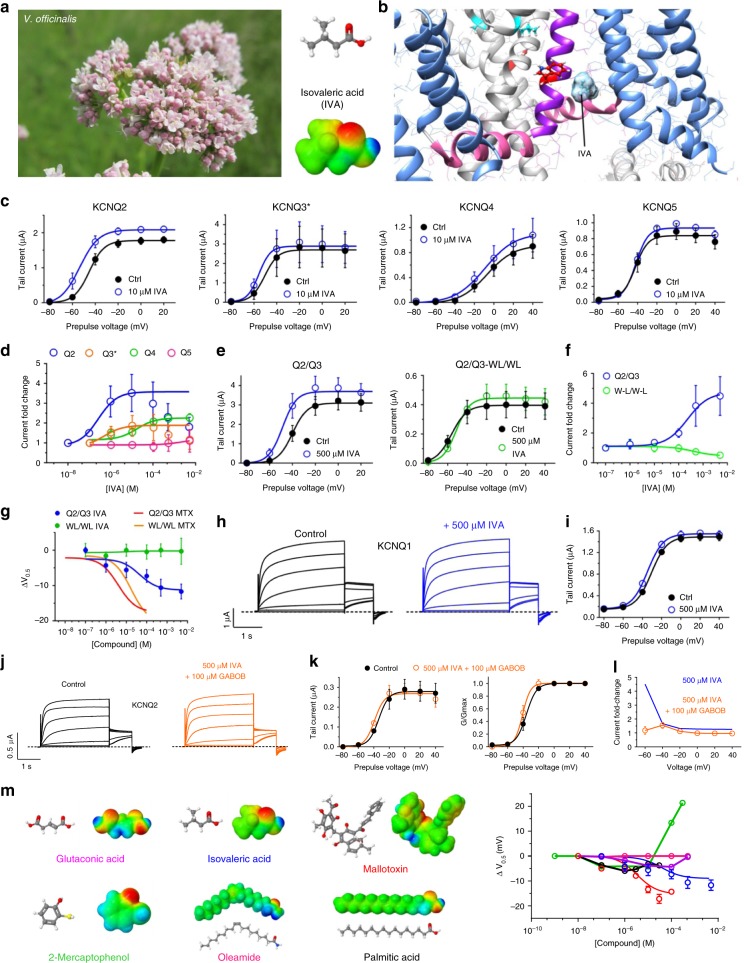
Fig. 5.
IVA activates neuronal KCNQs with preference for KCNQ2. a Left, Valeriana officinalis. Right, structure (upper) and electrostatic surface potential (red, negative; blue, positive) (lower) of isovaleric acid (IVA). b Binding position of IVA in KCNQ3 predicted by SwissDock using a chimeric KCNQ1–KCNQ3 structure model. c Mean tail current versus prepulse voltage relationships recorded by TEVC in Xenopus laevis oocytes expressing homomeric KCNQ1–5 channels in the absence (black) and presence (blue) of IVA (n = 4–7). Voltage protocol as in Fig. 1d. d IVA dose response at −60 mV for KCNQ2–5, quantified from data as in c (n = 4–7). e Mean tail current versus prepulse voltage relationships for wild-type KCNQ2/3 (left) or KCNQ2-W236L/KCNQ3-W265L (right) channels in the absence or presence of IVA as indicated (n = 4–6). Voltage protocol as in Fig. 1d. f Dose response for current increase at −60 mV in response to IVA for channels as in e. g Dose response for the V0.5 of activation shift induced by IVA versus MTX in wild-type KCNQ2/3 versus KCNQ2-W236L/KCNQ3-W265L (WL/WL) channels. IVA data (n = 4–6) quantified from e; MTX data from Fig. 3d. h Averaged traces for KCNQ1 in the absence or presence of IVA (500 µM); n = 6. i Mean data from traces as in h. j Exemplar traces showing effects of IVA (500 µM) with GABOB (100 µM) on KCNQ2/3 channels. Voltage protocol as in Fig. 1d. k Effects of IVA (500 µM) with GABOB (100 µM) on mean tail current (left) and G/Gmax (right) relationships for KCNQ2/3 (n = 5) calculated from traces as in panel j. l Current fold-change at −60 mV exerted by IVA (500 µM) alone (from panel f) or with 100 µM GABOB, from data as in panel k (n = 5). m Right, dose responses for the shift in V0.5 of KCNQ2/3 activation induced by the leaf extract compounds shown on left, calculated from traces as shown in Figs 1, 2 and 5 (n = 4–16). All error bars indicate SEM

