Fig. 8.
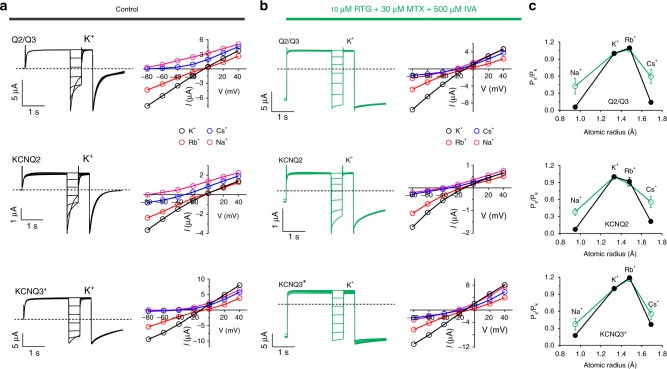
RTG + MTX + IVA alter the pore conformation of KCNQ2 and KCNQ3. a, b Left, exemplar traces; right, mean I/V relationships for KCNQ2/3 (Q2/Q3) or homomeric KCNQ2 or KCNQ3 channels as indicated, bathed in 100 mM K+, Rb+, Cs+, or Na+ in the (a) absence or (b) presence of RTG (10 µM) + MTX (30 µM) + IVA (500 µM); n = 6–7. c Relative ion permeabilities of KCNQ2/3 channels in the presence (green) or absence (black) of RTG (10 µM) + MTX (30 µM) + IVA (500 µM); n = 6–7. Quantified from traces and plots as in panels a, b. All error bars indicate SEM

