
Fig. 1. Genetically matched tusks between large ivory seizures.
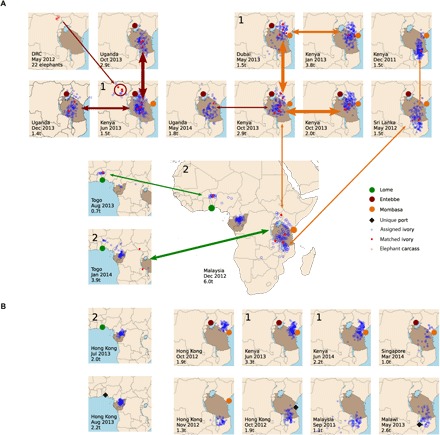
Large ivory seizures made between December 2011 and May 2014, with (A) and without (B) genetically matched tusks between the seizures. The location, date, and weight [in metric tons (t)] of each seizure are written in the lower left corner of each map. The locations where each seizure transited out of Africa are indicated by large colored circles (maroon, orange, and green), with the exception of unique ports (black diamonds) that appear only once. Countries colored dark brown indicate poaching centers (5). The genetically assigned geographic origin of each tusk within the seizure is illustrated by blue circles. Matched tusks between seizures are indicated by solid red circles. Double headed arrows connect matched seizures; arrow thickness denotes the number of matching samples between the two seizures; and arrow color corresponds to the last common port of transit between matched seizures. Seizures linked by one or more types of nongenetic forensic evidence are indicated by the same number in the upper left-hand corner of their respective maps. 1 = same clearing agent, shared cell phone number, vehicle or owner of vehicle transporting ivory, owner of shipment, law enforcement impressions; 2 = ivory concealed under sawn mahogany planks.