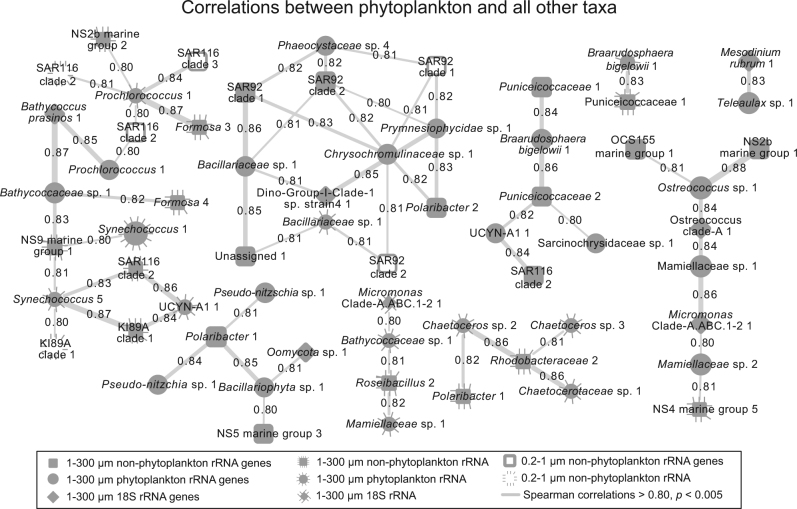
Fig. 6.
Network showing pairwise positive correlations between phytoplankton and non-phytoplankton or Eukaryota rRNA and rRNA ASV or OTU relative proportions. As in Fig. 4, nodes filled in with gray shading are from the 1–300 µm size fraction and those with no shading (open) are from the 0.2–1 µm size fraction. A dashed line surrounding a node indicates the node represents data from the rRNA sequence data set, whereas a solid line or no-line indicates rRNA gene sequence data set. Connecting lines indicate positive correlations (Spearman > 0.80, p & q < 0.001) and line thickness corresponds with strength of correlation. Only taxa with average relative abundance >0.5% are shown

