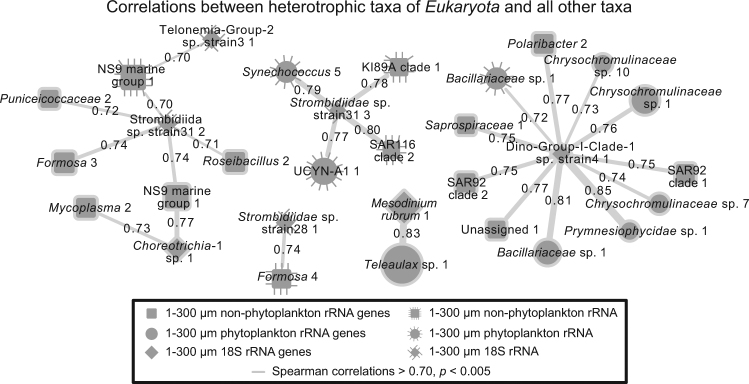
Fig. 7.
Network showing pairwise positive correlations between heterotrophic Eukaryota to Bacteria and phytoplankton. Vertical lines surrounding a node indicates the node represents data from the rRNA sequence data set, whereas no-line indicates rRNA gene sequence data set. Lines connecting edges indicate correlations (Spearman > 0.70, p & q < 0.001; no correlations were observed <−0.70) and line thickness corresponds with strength of correlation. MAST heterotrophs would not show (see methods)

