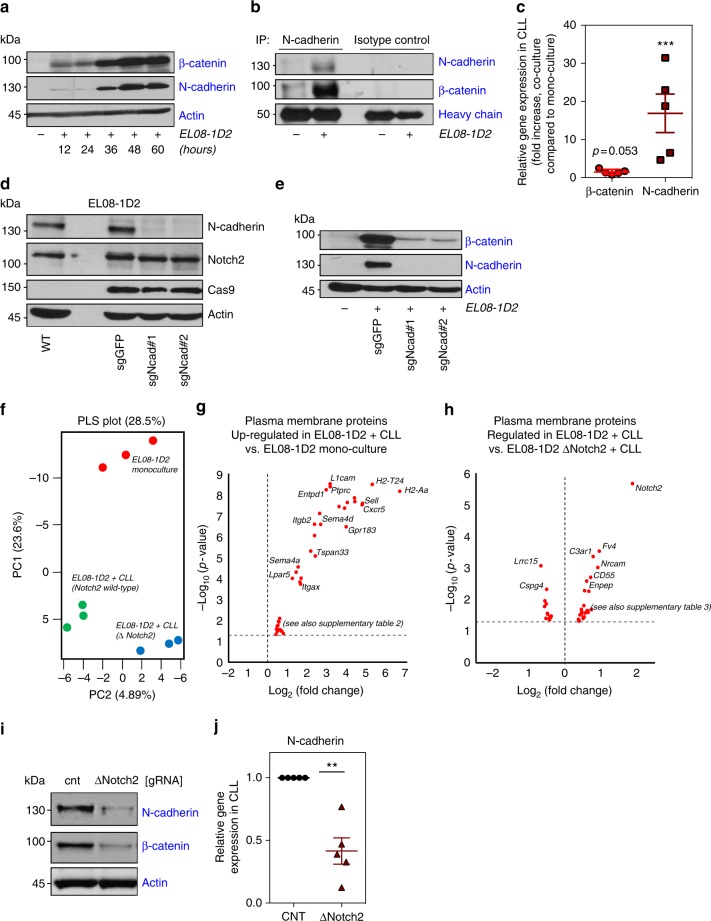
Fig. 5.
Stabilisation of β-catenin is partially dependent on N-cadherin. a CLL cells were co-cultured on EL08-1D2 cells. After the time points as indicated, N-cadherin and β-catenin expression were analysed. Two additional experiments revealed similar results. b N-cadherin was immunoprecipitated from CLL lysates derived from mono-cultures or from co-cultures with EL08-1D2 cells. One out of three experiments is shown. c Quantitative reverse-transcription polymerase chain reaction analysis of β-catenin (red circles) and N-cadherin (ruby squares) mRNA expression in primary CLL cells 24 h after co-culture with EL08-1D2, normalised to expression in mono-cultured cells. Shown is the mean ± standard deviation of five independent primary CLL cells; ***p < 0.001. d Cas9-expressing EL08-1D2 cells were transfected with two different guide RNAs (sgRNAs) against N-cadherin. Constitutive expression of N-cadherin and Notch2 is shown. e CLL cells were co-cultured on N-cadherin-proficient or -deficient EL08-1D2 cells. Expression of β-catenin and N-cadherin in CLL cells is shown after 72 h. One representative experiments out of three is depicted. f Partial least square (PLS) analysis of all proteins detected and quantified by mass spectrometry. Three biological replicates were performed with one CLL patient sample. g Volcano plot showing the differentially up- and down-regulated plasma proteins in EL08-1D2 cells after 48 h of co-culture with CLL cells compared to EL08-1D2 cells in mono-culture. h Volcano plot showing the differentially up- and down-regulated plasma proteins in EL08-1D2 cells after 48 h of co-culture with CLL cells. Comparison between Notch2-proficient and Notch2-deficient stromal cells. i Analysis of N-cadherin and β-catenin levels in primary CLL cells co-cultured for 48 h on BMSCs in which Notch2 was deleted by Cas9. Representative results from three different patients are shown. j Quantitative reverse-transcription polymerase chain reaction analysis of N-cadherin mRNA expression in primary CLL cells 48 h after co-culture on Notch2-deficient EL08-1D2 cells (ruby triangles), normalised to expression in control cells (black circles). Shown is the mean ± standard deviation of five independent experiments with individual primary CLL cells; **p < 0.01

