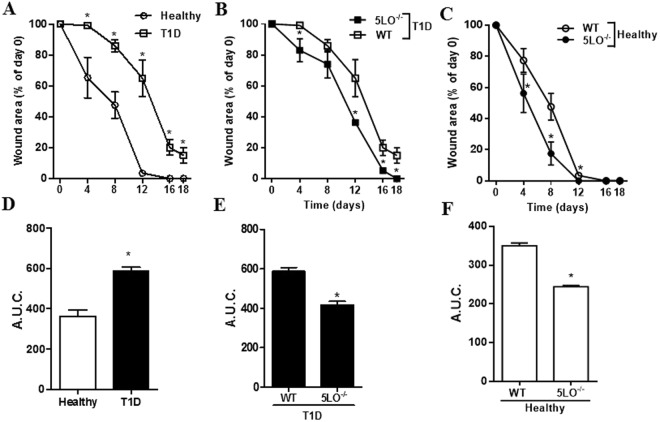
Figure 7.
Lesion area measurement in wounds from diabetic 5LO−/− or WT mice. Lesion areas from WT or 5LO−/− mice, healthy or diabetic (T1D), were calculated using Image J and the measurements obtained in mm on Day 0 were considered 100% of the lesion (A–C). Area under curve (AUC) analyses were performed according to data from timeline graphs (D–F). Data are presented as the mean ± SEM of 4 to 8 animals per group in 2 independent experiments. *p ≤ 0.05 when the diabetic WT group was compared to healthy WT.

