Figure 2.
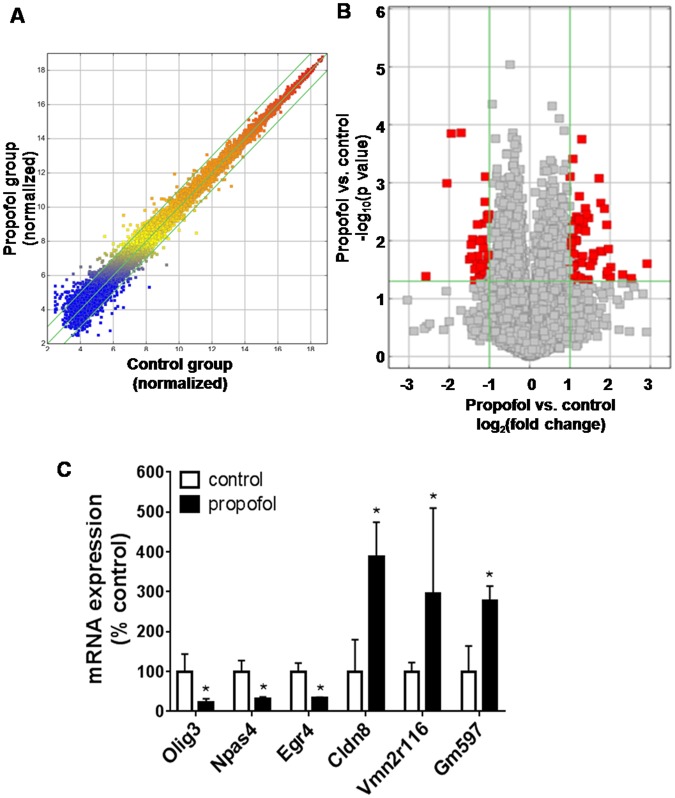
Propofol exposure results in the dysregulated mRNA profiles in P7 mouse hippocampi. (A) Scatter plot displaying that the overall mRNA transcriptome is similar between intralipid- and propofol-treated mouse hippocampal samples. (B) The volcano plot illustrating the differentially expressed mRNAs (red dots) between control and propofol groups. All mRNAs profiled were represented as points in the scatter plot with fold change and p value on the x and y axis, respectively. These altered mRNAs were either downregulated (left red dots) or upregulated (right red dots) following propofol exposure. (C) Reverse transcription-quantitative polymerase chain reaction (RT-qPCR) validation of propofol-induced changed mRNAs with top 3 highest up-regulated and top 3 down-regulated (including Olig3, Npas4, Egr4, Cldn8, Vmn2r116 and Gm597) according to the microarray assay. n = 4; *p < 0.05.

