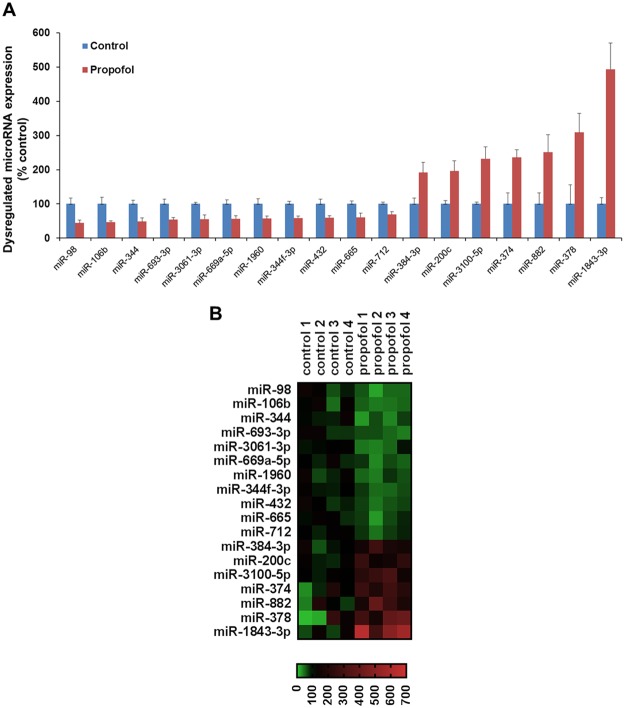
Figure 3.
Propofol induces the dysregulation of miRNA profiles in 7-day-old mouse hippocampi. (A) Expression profile of altered miRNAs detected using RT-qPCR. miRNA expression in the propofol-treated group is expressed as percent of intralipid controls. (B) Heatmap showing the profiles of 18 differentially expressed miRNAs between intralipid and propofol-treated mouse hippocampi. The red, green, and black signals refer to the relatively higher, lower, and baseline levels of miRNA expression compared with the control group, respectively. Expression level of each sample for individual miRNAs was displayed as percentage of the control average. n = 4; p < 0.05.

