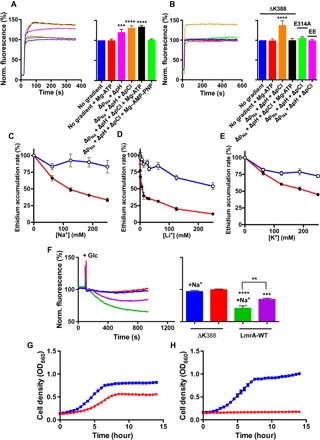
Fig. 4. Ion exchange is linked to drug transport.

(A and B) Transport of ethidium (2 μM) in DNA-loaded proteoliposomes containing LmrA-WT (A) or ATPase-deficient LmrA-ΔK388 or proton transport–deficient LmrA-E314A (B) in an inside-out fashion, in the absence or presence of nucleotide and/or the stepwise imposition of a sodium-motive force ΔpNa (interior positive and [Na+]in/([Na+]out = 100 mM/1 mM), chemical proton gradient ΔpH (pHin 8.0/pHout 6.8), and chemical chloride gradient ΔpCl ([Cl−]in/([Cl−]out = 50 mM/150 mM). Line colors are the same as bar colors and refer to the same experimental conditions. (C to E) Effect of salts on the ethidium accumulation rate in cells with (black circles) and without LmrA (white circles) as a percentage of the rate in the absence of salts. (F) Effect of 100 mM NaCl in the external buffer on ethidium efflux from cells preloaded with 2 μM ethidium. Efflux was initiated by the addition of 25 mM glucose (+Glc) as a source of metabolic energy. (G and H) Growth of L. lactis expressing LmrA-WT (blue trace) or LmrA-ΔK388 (red trace) in the presence of 4 μM ethidium in standard M17 medium (pH 7.0) (G) or M17 medium containing 16.7 mM NaOH (pH 7.5) plus 25 mM NaCl (H). The error bars for some of the data points are too small to be displayed and are hidden behind the data point symbols. Data represent observations in three or more independent experiments with independently prepared batches of proteoliposomes and cells. Values in histograms show significance of fluorescence levels at steady state and are expressed as means ± SEM (***P < 0.001, ****P < 0.0001, one-way ANOVA).
