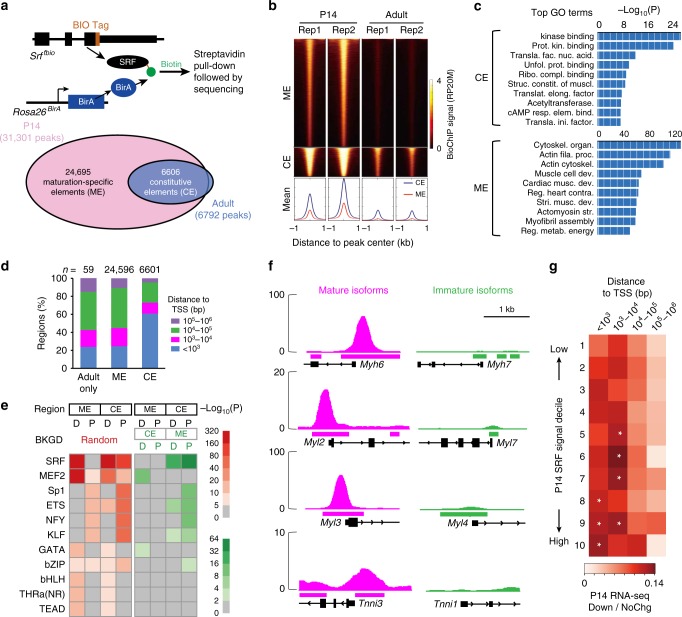
Fig. 4.
Stage-specific SRF chromatin occupancy determines its maturation-specific regulation of gene expression. a SRF bioChIP-Seq at P14 and adult stages identified chromatin regions bound by endogenous SRF in hearts. These regions were grouped into maturation-specific elements (MEs) uniquely present at P14, and constitutive elements (CEs) found at both P14 and adult stages, and adult-only elements. b SRF bioChIP-seq signal on CEs and MEs. Each row shows SRF signal of a genomic region centered on a CE or ME and extending 1 kb upstream and downstream. Plots below show average signal at these regions. c GO term analysis of genes associated with CEs or MEs. d Distance of SRF-bound regions to the nearest transcriptional start site (TSS) for peaks found at P14 only (ME), P14 and adult (CE), or adult only. e Analysis of TF motifs enriched in the central 200 bp of CEs and MEs at proximal (TSS ±1 kb) or distal regions. The 1000 regions with the greatest SRF signal in each group was used for this analysis. Non-redundant motifs with P < 10–5 are shown. Left and right panels show enrichment compared to randomly permuted background or the indicated set of comparison sequences, respectively. P values were calculated by Homer65 using a negative binomial distribution. f SRF bioChIP-seq signal at P14 at four SRF-dependent mature myofibrillar genes (magenta) and their immature paralogs (green). Called peak regions are labeled as bars below the signal plot. g Relationship between peak distance to TSS, peak SRF occupancy signal, and likelihood of gene down-regulation on SRF knockout. SRF-occupied regions were divided into deciles by SRF bioChIP-seq signal. Color represents the ratio of down-regulated to unchanged genes. One-tailed Fisher's exact test: *P < 0.05

