Fig. 6.
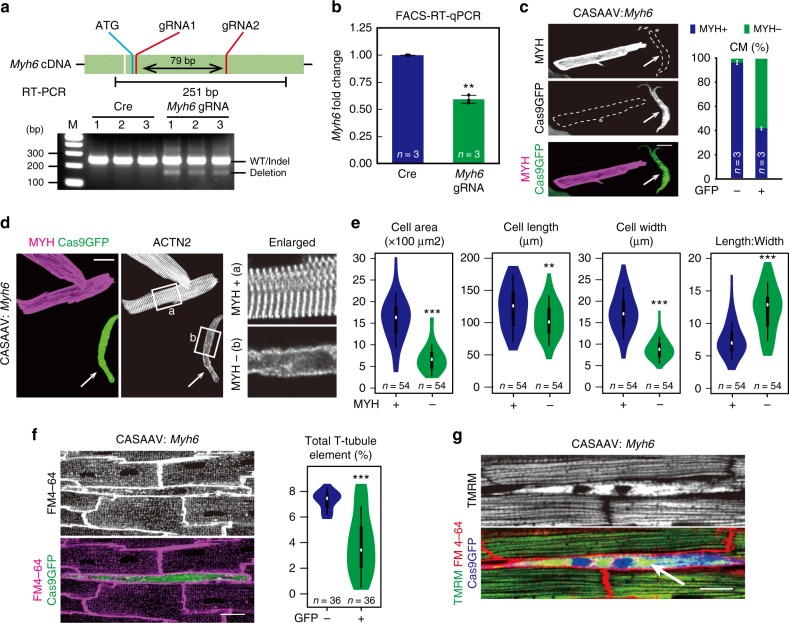
Sarcomere assembly is essential for other aspects of CM maturation. a CASAAV ablation of Myh6. Dual gRNAs targeting the first coding exon of Myh6 gene induced Cas9-mediated deletion of the intervening genomic region when delivered to P1 CMs using the CASAAV system. Deletion validation and phenotypic analyses were performed at P14 and 1 month after injection, respectively. Deletion was monitored by RT-PCR. b Validation of Myh6 depletion. After CASAAV-based neonatal Myh6 mutagenesis, FACS-sorted GFP+ CMs at P14 were used to quantify Myh6 by RT-qPCR. c Identification of individual CMs with successful MYH6 depletion by myosin heavy chain (MYH) immunofluorescence staining (arrow). Cell boundaries were delineated by dashed lines. The fraction of cells that were depleted of MYH was quantified to the right. d Sarcomere loss in CMs depleted of MYH6. After Myh6 CASAAV, dissociated CMs were stained for ACTN2. Arrow points to a MYH-depleted CM. Boxed regions are enlarged to the right. e MYH6 depletion disrupted maturational hypertrophic growth of CMs. MYH6-depleted CMs were identified by immunostaining. f MYH6 depletion disrupted T-tubulation. T-tubule organization was measured by in situ imaging and AutoTT quantification. Representative image shows defective T-tubules within a Cas9GFP+ cell. g MYH6 depletion caused mitochondrial disorganization. Mitochondria were imaged in situ by TMRM staining. GFP− cells (no blue pseudocolor) had highly organized arrays of mitochondria, unlike the mitochondrial staining pattern in GFP+ cells (arrow). Scale bars, 20 μm in all images. Violin plots are described in Fig. 2. Bar plots show mean ± SD and are overlaid by dot plots. Numbers in bar indicate sample size. Two-tailed Student’s t test: **P < 0.01, ***P < 0.001

