Fig. 7.
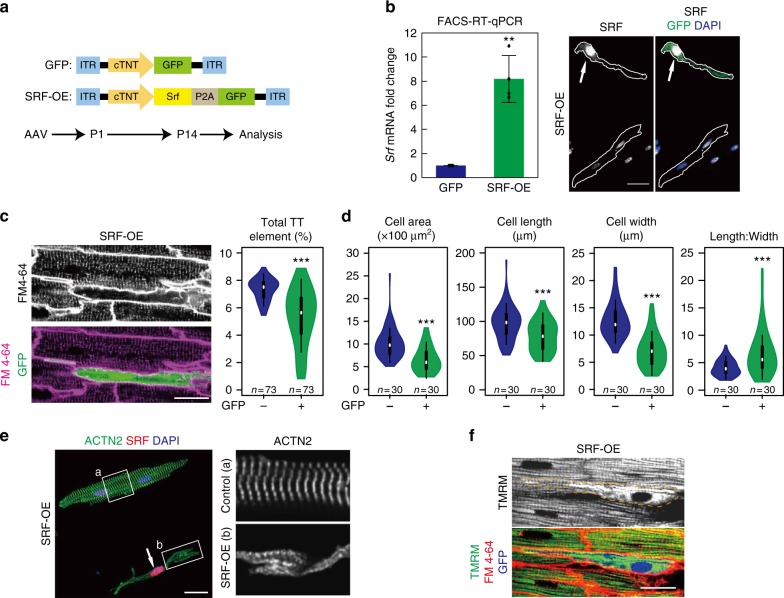
SRF overexpression perturbs CM maturation. a Schematic design of AAVs overexpressing SRF (SRF-OE) or GFP (control). AAVs were injected into P1 pups. Analysis of maturation was performed at P14. b RT-qPCR of FACS-sorted P14 GFP+ CMs validated Srf overexpression (left, n = 4 hearts). Immunofluorescence confirmed nuclear localization of overexpressed SRF proteins in GFP+ CMs (right). Cell boundaries are delineated by white lines. c SRF overexpression disrupted T-tubulation. T-tubule organization was measured by in situ imaging (left) and AutoTT quantification (right). SRF-overexpressed CMs were labeled by GFP. d SRF overexpression disrupted maturational hypertrophic growth of CMs. e Sarcomere disorganization in CMs overexpressing SRF. Dissociated CMs were stained for ACTN2. Boxed areas are enlarged (right). Arrow points to a validated SRF (red) overexpressing CM. f SRF overexpression caused mitochondrial disorganization. Mitochondria were imaged in situ by TMRM staining. GFP− cells (no blue pseudocolor) had highly organized arrays of mitochondria, unlike the mitochondrial staining pattern in GFP+ cells (cell boundary delineated). Scale bars, 20 μm in all images. Violin plots are described in Fig. 2. Bar plots show mean ± SD and are overlaid by dot plots. Two-tailed Student’s t test: **P < 0.01, ***P < 0.001

