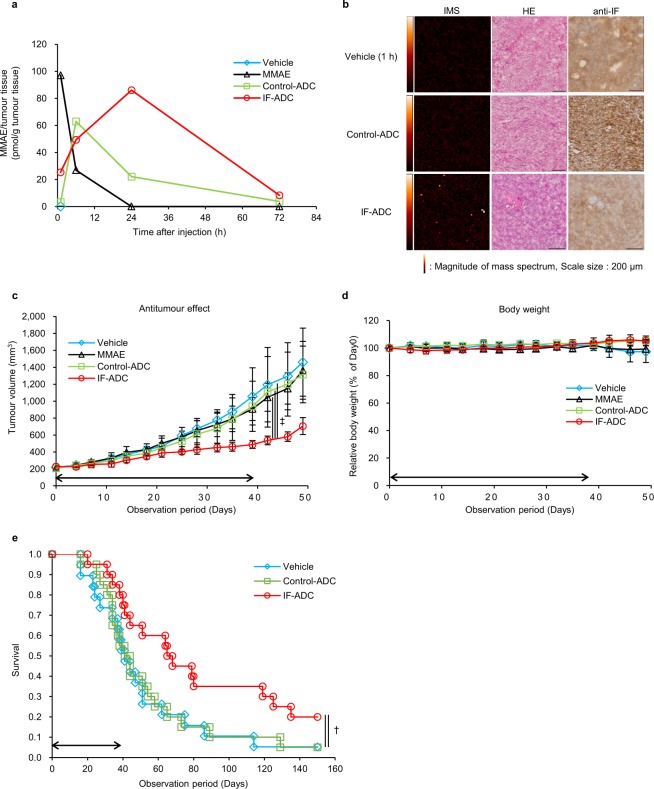
Figure 3.
Antitumour effect and time course of MMAE in the tumours delivered by ADCs. (a) Time course of free MMAE in a tumour measured by LC-MS/MS (n = 1). (b) Imaging mass spectrometry of free MMAE in tumour specimens of ADCs after 24 h of administration (Vehicle; 1 h). Left panel shows IMS, middle panel shows HE staining, and right panel shows anti-IF staining of each specimen. Colour dots from red to white denote drug signal originating from MMAE. (c) Antitumour effect in mice bearing 5–11 xenografts. MMAE and ADC dosage and observation were started when the tumour volume reached approximately 200–300 mm3 with 20 mg/kg ADC (equivalent to 0.3 mg/kg MMAE) or 0.3 mg/kg MMAE twice a week, 12 times total intravenously. Vehicle was administered as a control at equal volume of ADCs. (n = 7). Statistical analysis was performed using one-way repeated measurement ANOVA. ‡P < 0.01. (d) Body weight change in mice bearing 5–11 xenografts. Body weight was measured before every injection or once a week after the administration period. (e) Survival of KPC mice over time with and without ADC treatment. Eight-week-old KPC mice began being administered ADCs with 20 mg/kg (equivalent to 0.3 mg/kg MMAE) twice a week, 12 times total intravenously. Vehicle was administered as a control at equal volume of ADCs. All results are presented as the mean ± s.d. Survival curves were described with the Kaplan-Meier method (n = 20), and comparison of survival curves was carried out with the Log-rank test. †P < 0.05.

