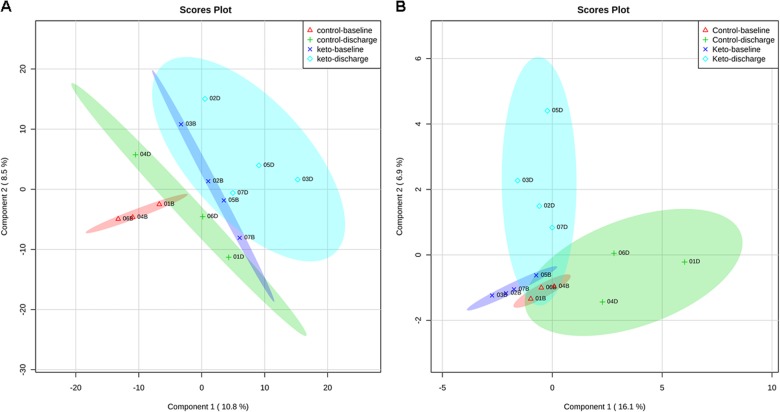
Fig. 2.
Partial least squares-discriminant analysis (PLS-DA) scores plot from the LC-MDS metabolomics data collected in negative (a) and positive ion (b) modes between selected principal components 1 and 2 in the ketogenic diet (KD, patient codes: #02, 03, 06, and 07) vs. standard diet (SD, patient codes: #01, 04, and 05) group data. Each component is the sum of the contributions made by each metabolite ion to it. The ellipses represent the 95% confidence limits for each group (red—baseline (B) standard diet, green—discharge (D) standard diet, blue—baseline (B) keto diet, light blue—discharge (D)

