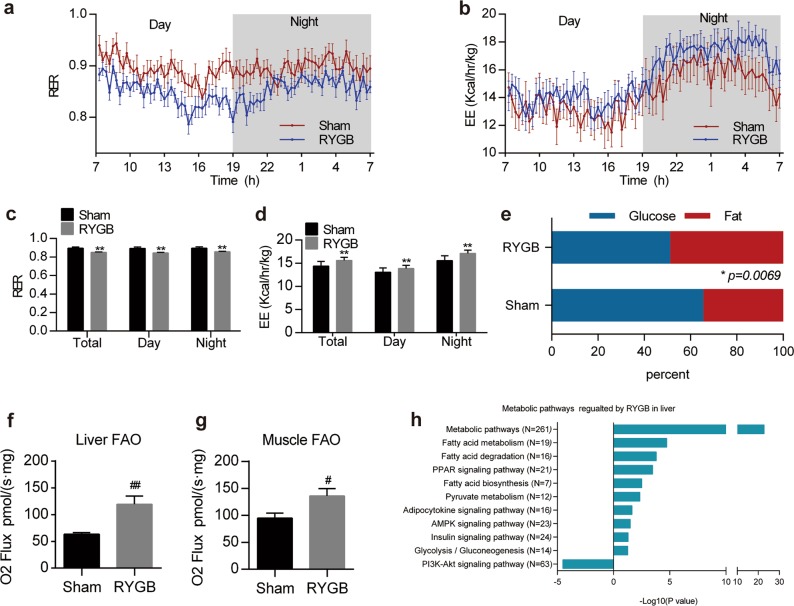
Fig. 4. Effect of RYGB on metabolic profiles and energy expenditure.
a–d RER and EE values of sham and RYGB mice (a, b) (n = 12). Quantitative results are shown in c, d. e Oxidation ratio of glucose and fat in sham and RYGB rats (n = 12). f, g Mitochondrial fatty acid oxidative activity in the liver and skeletal muscle from sham and RYGB rats (n = 8). h Enriched metabolic pathways in the rat liver regulated by RYGB (n = 3). Values are shown as the mean ± s.e.m. Significance was calculated using two-way ANOVA with Tukey’s post hoc analysis (c, d) or the two-tailed unpaired t-test (e-g). *P < 0.05 and **P < 0.01 compared with the sham group

