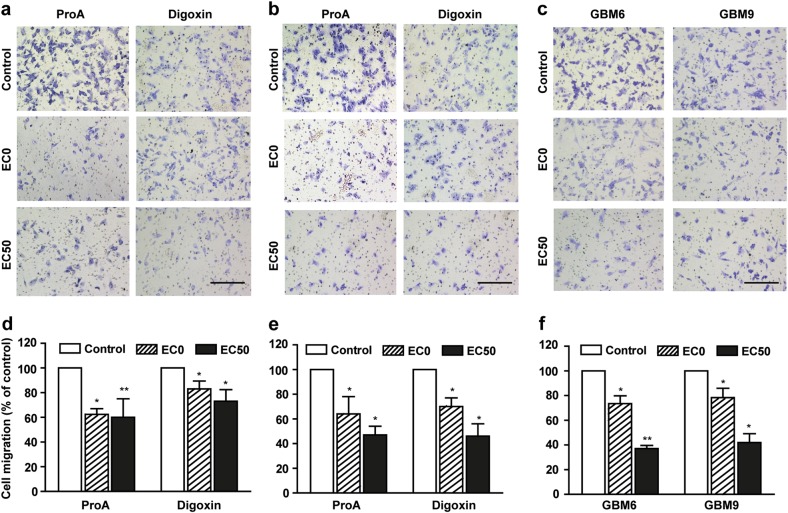
Fig. 2. ProA displayed antimigratory properties on GBM cell lines.
Representative images and quantification of U87-MG (a, d), U251-MG (b, e) migratory cells treated with vehicle (control), ProA and digoxin (at EC0 and EC50) for 5 h using the transwell migration assay. Representative images and quantification of migratory cancer stem-like cells GBM6 and GBM9 (c, f) treated with vehicle (control) or ProA (at EC0 and EC50) for 5 h using the transwell migration assay. Bar = 200 μm. Quantification was expressed as percentage of migrating cells relative to 100% of control cells. At least three independent experiments were performed for each condition. Bar ± SEM. *p < 0.05; **p < 0.005

