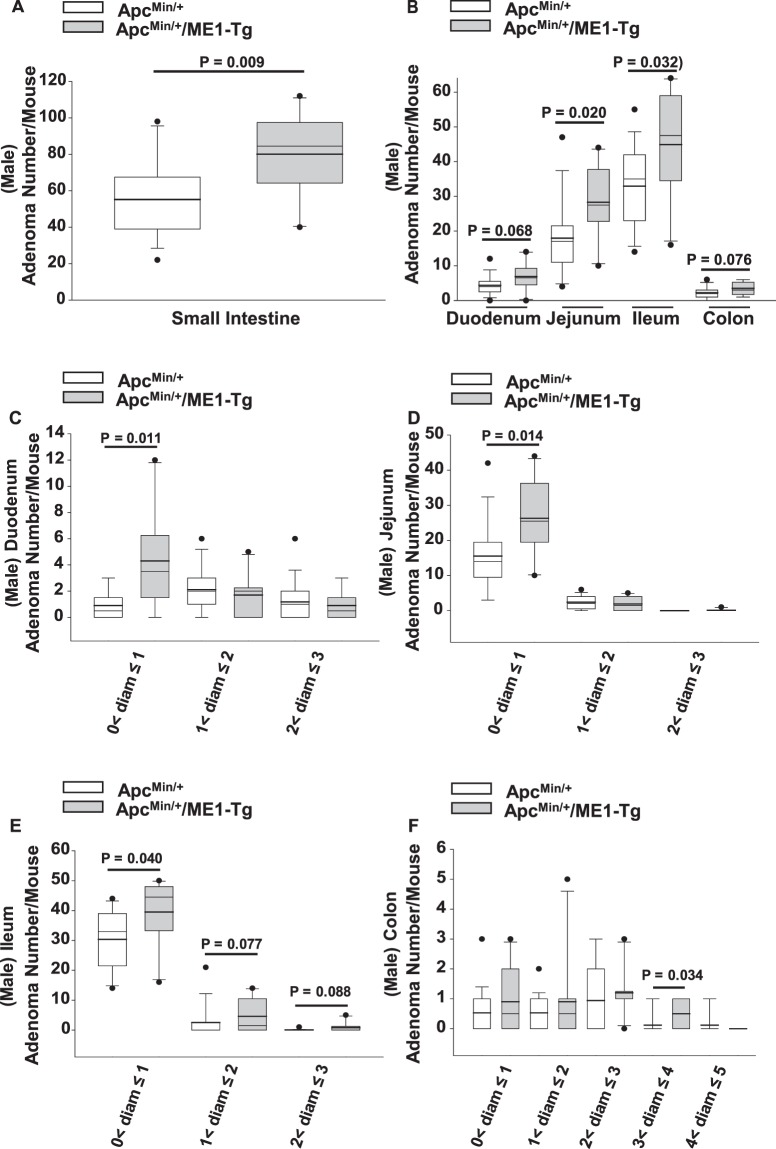
Figure 2.
Adenoma burden in male ApcMin/+/ME1-Tg mice. (A) Total number of adenomas/mouse in the small intestines of sixteen-week-old ApcMin/+ (n = 17) and ApcMin/+/ME1-Tg (n = 10) male mice. (B) Regional distribution of adenomas in male mice. (C–F) Size distribution of adenomas in the (C) duodenum, (D) jejunum, (E) ileum and (F) colon of sixteen-week-old male ApcMin/+ and ApcMin/+/ME1-Tg mice. Boxes indicate the inter-quartile range (25–75%) with mean (thick line) and median (thin line); whiskers: 10th and 90th percentiles; dots: outliers. Student’s t-tests were used to examine for differences between groups and the Mann-Whitney Rank Sum Test was used for comparing non-normally distributed data. Significant differences were identified by P < 0.05. Tendencies for differences also are indicated (0.1 > P > 0.05).

