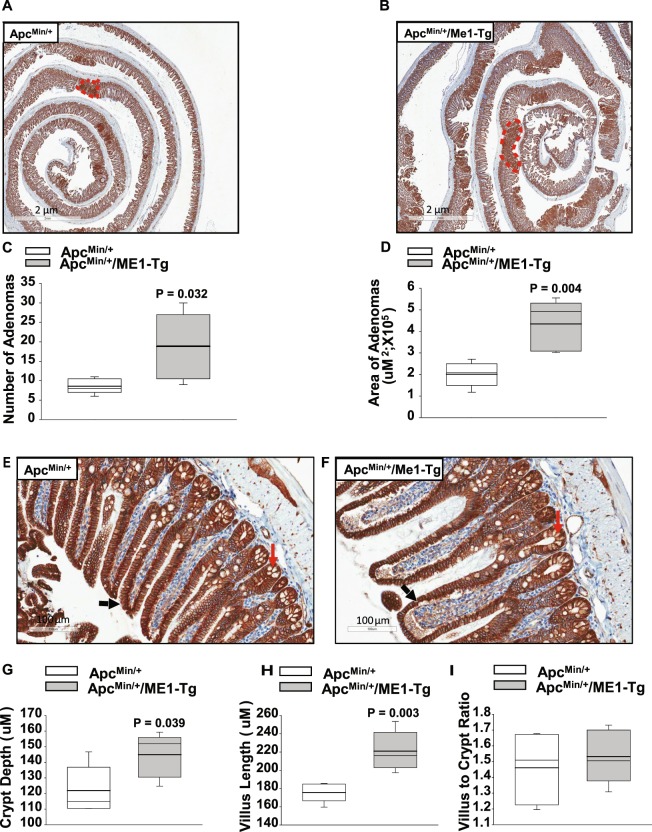
Figure 3.
Increased numbers and sizes of ileal adenomas in sixteen-week-old male ApcMin/+/ME1-Tg mice. (A,B) Representative β-catenin IHC of ilea from ApcMin/+ and ApcMin/+/ME1-Tg male mice (scale bar = 2 μm). A representative adenoma is outlined in red in each panel. (C) Total number of ileal adenomas quantified after β-catenin IHC of male mice (n = 5/group). (D) Area of ileal adenomas (total adenoma area per mouse) quantified after β-catenin IHC (n = 5 male mice/group). (E,F) Representative images of β-catenin-stained ileum showing normal appearing crypts and villi (scale bar = 100 μm). Black and red arrows indicate villi and crypts, respectively. (G) Quantification of ileal crypt depth in ApcMin/+ and ApcMin/+/ME1-Tg male mice (n = 5/group). (H) Quantification of ileal villus length in male mice (n = 5/group). (I) Ratio of villus length to crypt depth in the ilea of male mice (n = 5/group). Boxes indicate the inter-quartile range of 25–75% with mean (thick line) and median (thin line); whiskers extend to the 10th and 90th percentiles. Student’s t-tests were used to examine for differences between genotypes (significant difference, P < 0.05).

