Figure 5.
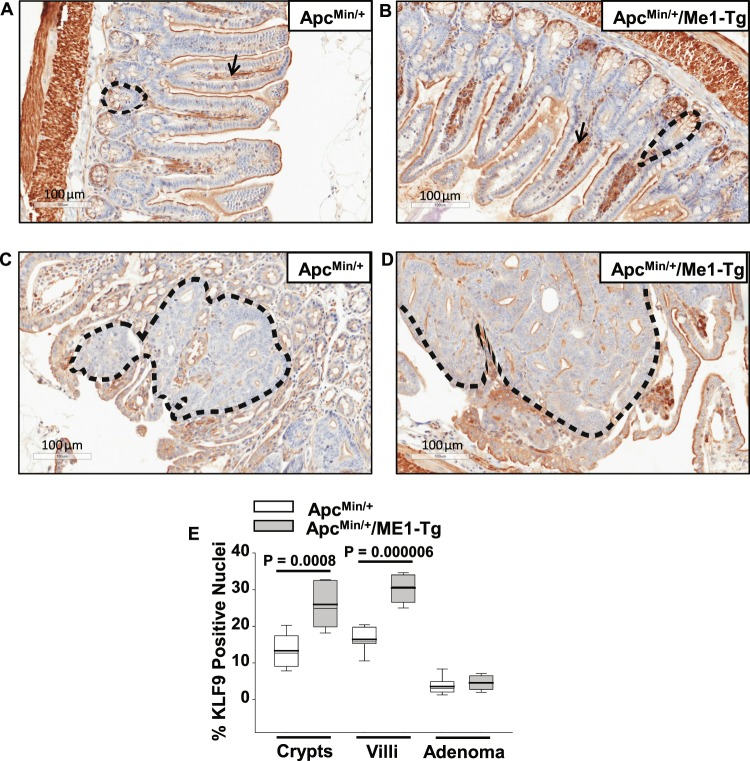
Increased KLF9 immunoreactivity in ileal crypts and lamina propria of sixteen-week-old male ApcMin/+/ME1-Tg mice. (A,B) Representative images of KLF9-positive cells in crypts (black dotted line), villi (epithelium and lamina propria), and muscularis of ApcMin/+ and ApcMin/+/ME1-Tg male mice (scale bar = 100 μm). Black arrows indicate representative KLF9 staining in the lamina propria. (C,D) KLF9 IHC of ileal adenomas from male mice (scale bar = 100 μm). Representative adenomas are outlined. (E) Quantification of KLF9 IHC results (n = 7 mice/group). Quantification was via the Aperio Imagescope nuclear algorithm. Boxes demarcate the inter-quartile range of 25–75% with mean (thick line) and median (thin line); whiskers: 10th and 90th percentiles. Student’s t-tests were used to examine for differences between genotypes.

