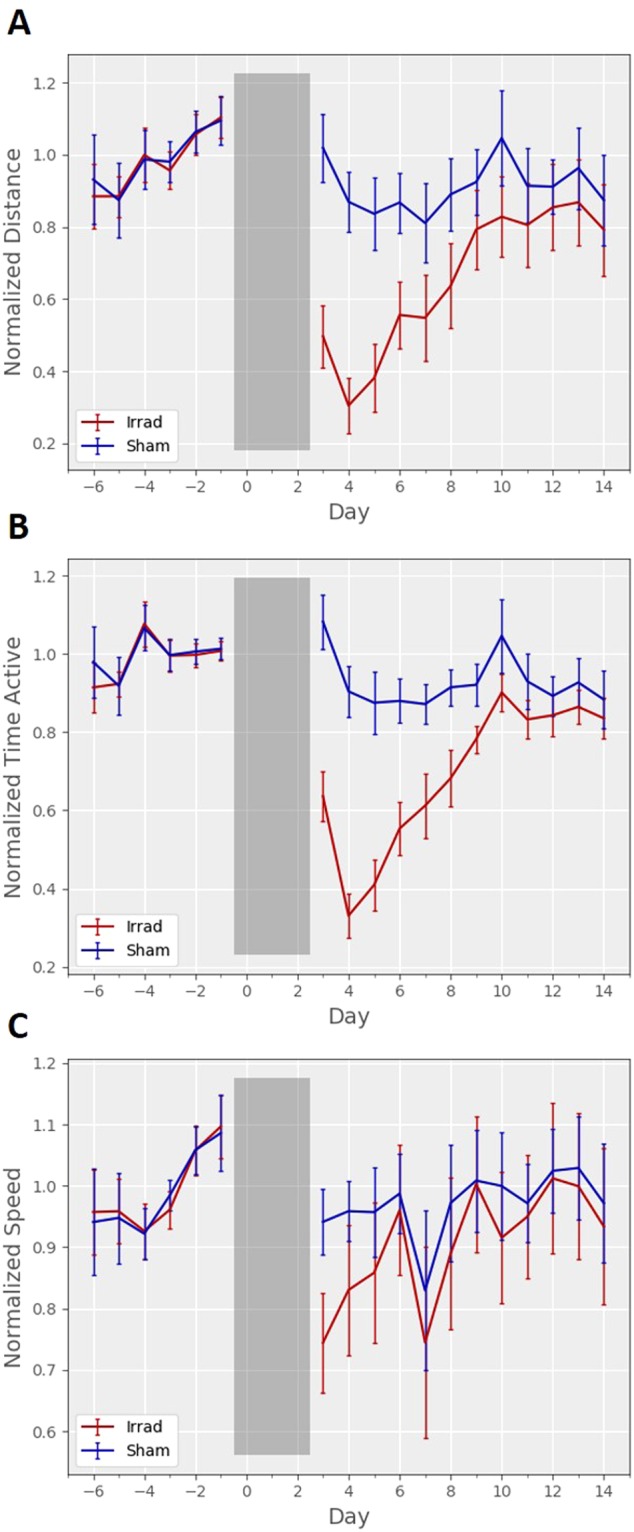
Figure 2.

Daily wheel running activity. (A) Daily total distances run on the wheels showed a significant difference between groups after irradiation (F1,61 = 15.83, p < 10−3). (B) “Time active,” the number of minutes during which a mouse used the running wheel, wheels showed a significant difference between groups after irradiation (F1,61 = 27.29, p < 10−5). (C) Average (mean) speed measurements showed higher variability and did not show a significant difference between groups after irradiation (F1,61 = 3.54, p = 0.065). Data are normalized to the mean total across the five days before irradiation, and error bars are 95% confidence intervals.
