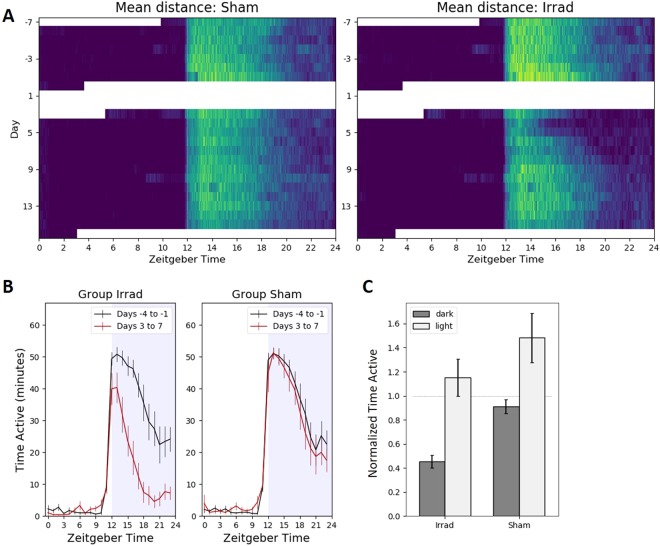
Figure 5.
Circadian running wheel activity patterns. Zeitgeber time = 0 when the lights are turned on at 6am. All error bars are 95% confidence intervals. (A) Color-coded activity for each minute of recording, with brighter colors corresponding to more running wheel activity. (B) Running wheel activity averaged for every hour across four days of baseline and four days of post-irradiation recording. After irradiation, the irradiated group ran significantly less during the dark (one-tailed Bonferroni-corrected paired t-test, t30 = 11.69, p < 10−18) but not during the light (t30 = 1.08, p = 0.29). (C) Running wheel activity averaged for the 12-hour light period and the 12-hour dark period across four days of baseline and four days of post-irradiation recording. There was a significant effect of irradiation (two-way ANOVA, F1,126 = 35.98, p < 10−7), but no significant interaction between irradiation and time period (F1,126 = 0.95, p = 0.3). Bonferroni-corrected p-values for two-tailed t-tests: Irrad dark vs light: t61 = 8.70, p < 10−11. Sham dark vs light: t61 = 5.37, p < 10−4. Dark, irrad vs sham: t61 = 11.66, p = 10−15. Day, irrad vs sham: t61 = 2.17, p = 0.14.

