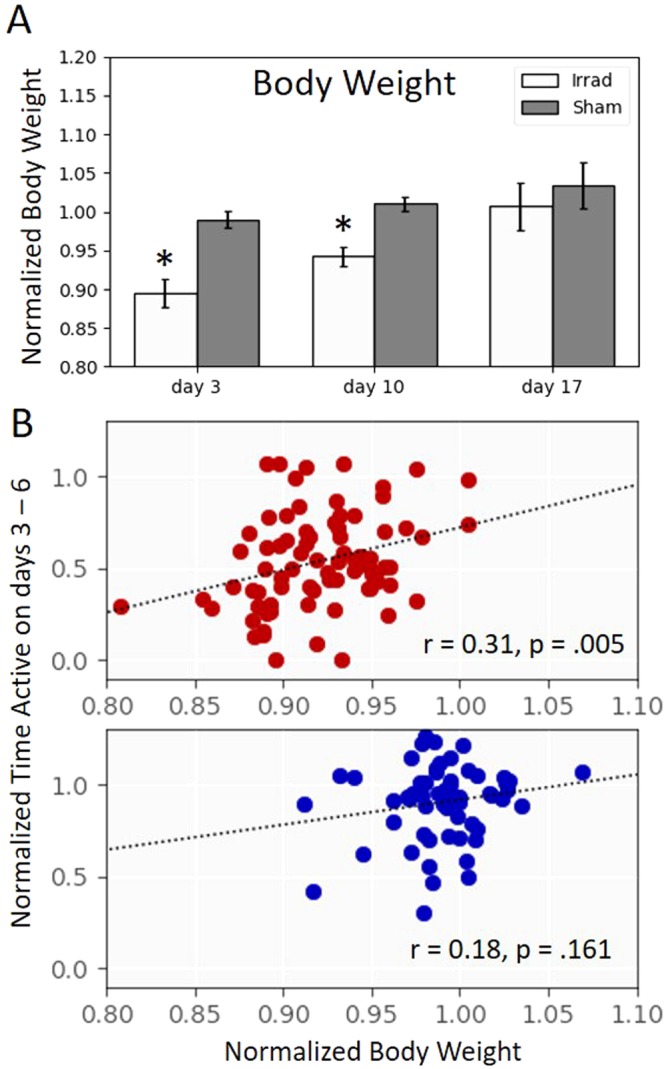
Figure 8.

(A) Body weights in the irradiated group, normalized to baseline, were significantly lower than sham at day 3 (t50 = 10.2, p < 10−13) and day 10 (t148 = 8.39, p < 10−13), but not at day 17 (t15 = 1.60, p = 0.12). Error bars are 95% confidence intervals. (B) A post-irradiation decrease in body weight significantly correlated with the time active on running wheels on the four days immediately after irradiation for the irradiated group (top, r = 0.31, p = 0.005, n = 81) but not the sham group (bottom, r = 0.18, p = 0.161, n = 63).
