Figure 1.
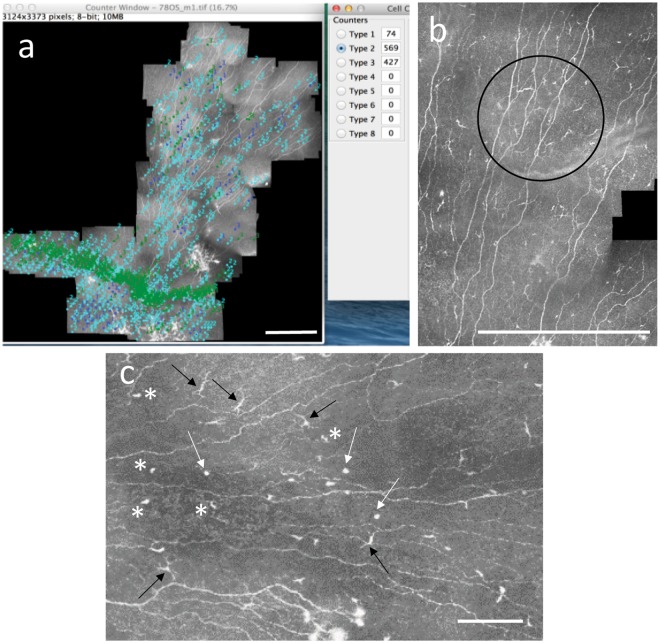
Quantification of cell parameters in the corneal sub-basal plexus. (a) Manual identification and quantification of different cell types in a mosaic image using ImageJ and the CellCounter plugin. The cells marked in dark blue (Type 1) are mDCs, those in light blue (Type 2) are imDCs, and those in green (Type 3) are globular cells. The mosaic is from a subject with normal glucose tolerance. (b) A zoomed-in section of a mosaic taken from a subject with long duration type 2 diabetes, indicating a clustering of mDCs (black circle). (c) Zoomed-in section of a mosaic indicating different morphologic appearance of the three different cell types quantified in this study. Black arrows indicate mDCs with clear, long dendrites, asterisks indicate imDCs with cell bodies or cell body with short dendrites visible. White arrows indicate globular cells, predominantly rounded and reflective and larger than imDC cell bodies, without visible dendrites. Note that for quantitative analyses, measurements were made independently by two trained observers and the average across both observers was taken. Scale bars A, B = 0.5 mm. Scale bar C = 0.1 mm.

