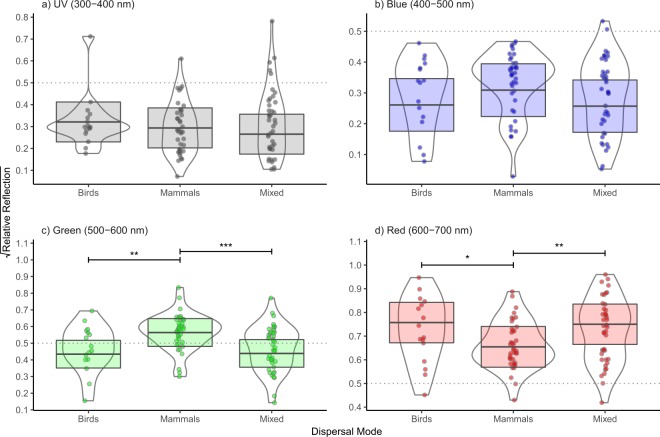
Figure 2.
Relative reflectance of fruit by dispersal mode. Horizontal bars indicate significant differences in reflectance between different dispersal categories. *<0.05, **<0.01, ***<0.001 (P values were adjusted using the Tukey method). The shaded boxes with the horizontal bars show the predicted means and standard errors of the PGLS models, which were estimated using the emmeans package in R63, and which were averaged over the levels of the categorical predictor variable site and assuming an average value for the numerical predictor variable leave reflectance in the respective colour band. The dashed grey lines at 0.5 root-squared relative reflectance were added to facilitate the comparison of the four plots.

