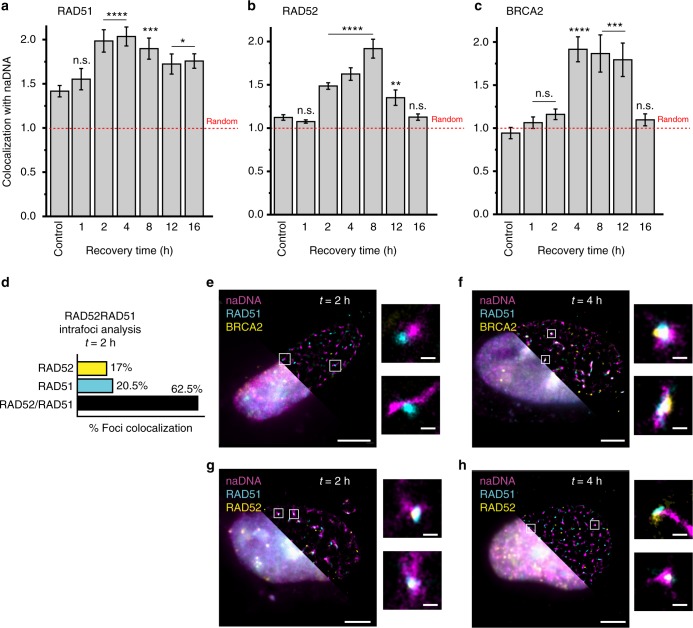
Fig. 2.
RAD52 colocalizes with RAD51 at damage sites prior to BRCA2 colocalization. a–c Kinetics of a RAD51, b RAD52, and c BRCA2 colocalization throughout repair (over 16 h of recovery). For complete N values, see Supplementary Table 1. Values were calculated using the Monte Carlo randomization method as described. This allowed the detected number/area of colocalization for each cell to be normalized to the predicted number/area of colocalization in a random simulation of the same cellular image. As plotted here: 1 indicates random overlap (shown as red dashed line), whereas 2 indicates double the number/area of overlaps as expected based on the randomized model. Colocalization in undamaged control cells also shown. Error bars represent mean ± s.e.m. Student’s t test for significance between control and damage levels. n.s.p > 0.05, *p < 0.05, **p < 0.01, ***p < 0.001, ****p < 0.0001. d Analysis of the colocalization of RAD51 and RAD52 at repair foci 2 h after damage. For complete N values, see Supplementary Table 2. e–h Representative whole-cell super-resolution (top right) and diffraction limited (bottom left) images of cells stained for e, f naDNA, RAD51, and BRCA2 or g, h naDNA, RAD51, and RAD52 at e, g 2 h of recovery or f, h 4 h of recovery. Zoomed in images show representative protein colocalization at naDNA foci. Whole-cell image scale bar = 3 μm, zoomed sections = 250 nm

