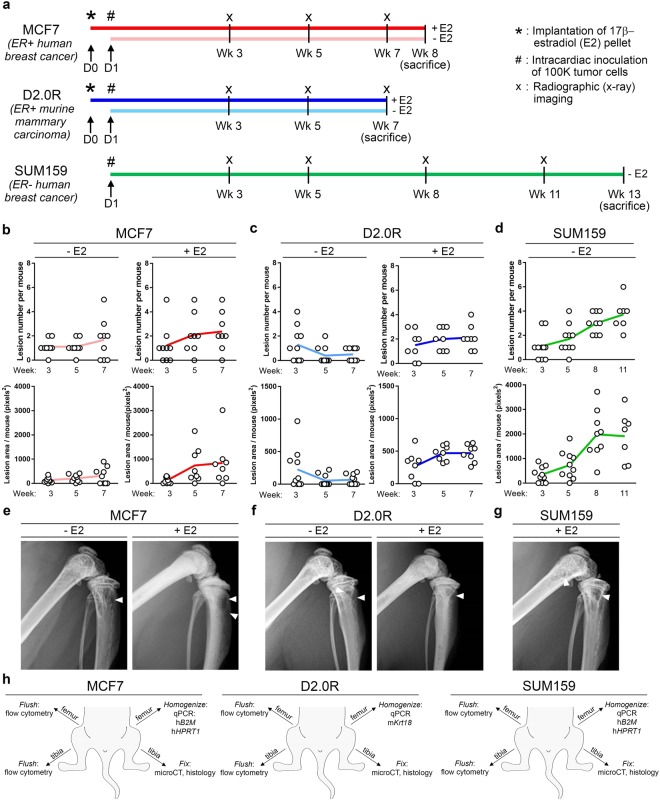
Figure 1.
Experimental timeline for MCF7, D2.0R, and SUM159 models and osteolysis. (a) Schematic of model timelines from implantation of 17β-estradiol pellets (indicated by asterisk) and inoculation of tumor cells (indicated by pound symbol) to sacrifice. Light colored lines = −E2 mice and dark colored lines = +E2 mice. n = 10 mice inoculated per group. (b–d) Radiographic assessment of total lesion number per mouse and total lesion area per mouse over time in the (b) MCF7 (n = 10 −E2 mice, n = 8 +E2 mice), (c) D2.0R (n = 10 –E2 mice, n = 8 +E2 mice) and (d) SUM159 models (n = 8 mice). (e–g) Radiographic images at week 7 for the (e) MCF7 and (f) D2.0R models and at week 11 for the (g) SUM159 models. White arrowheads indicate osteolytic lesions. (h) Schematic indicating the methods performed on the hind limbs for each tumor model.

