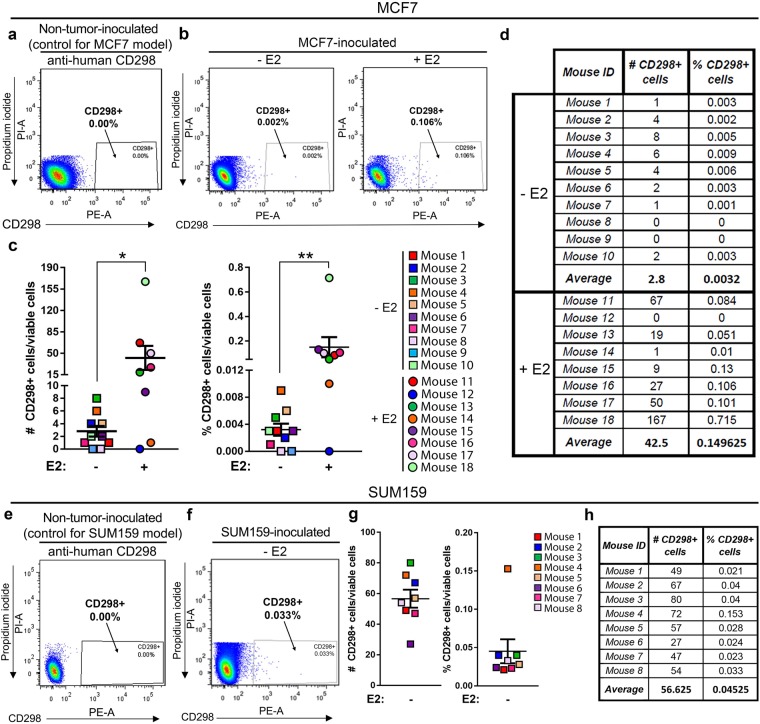
Figure 2.
Detection of CD298+ tumor cells in the bone using flow cytometry. (a) Representative flow cytometry plot of CD298 staining in non-tumor-inoculated (naïve) mouse bone marrow used as a negative control for the MCF7 model (representative of n = 3 mice). Dead cells (PI+) have been excluded. (b) Representative flow cytometry plots of bone marrow from MCF7-inoculated −E2 (n = 10 mice) and +E2 (n = 8 mice) mice. Dead cells (PI+) have been excluded. (c,d) Quantitation of total number and percent of CD298+ tumor cells from (b). (e) Representative flow cytometry plot of CD298 staining in non-tumor-inoculated (naïve) mouse bone marrow used as a negative control for the SUM159 model (representative of n = 3 mice). Dead cells (PI+) have been excluded. (f) Representative flow cytometry plot of bone marrow from SUM159-inoculated mice (n = 8 mice). Dead cells (PI+) have been excluded. (g,h) Quantitation of total number and percent of CD298+ tumor cells from (f). (c) Mann-Whitney U-Test, *P < 0.05 and **P < 0.01.

