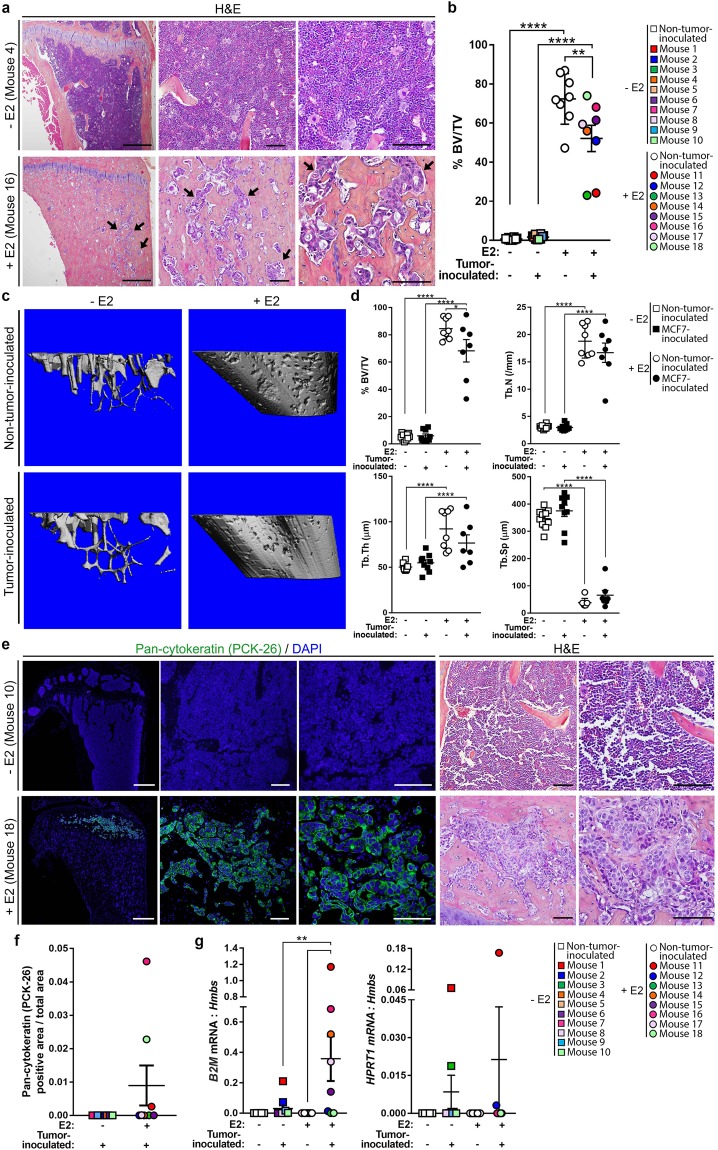
Figure 3.
Assessment of MCF7 tumor burden in the bone by histology, immunofluorescence, and qPCR. (a) Representative hematoxylin and eosin (H&E) images of tibiae from MCF7-inoculated mice from −E2 (n = 10 mice) and +E2 (n = 8 mice) mice. Arrows indicate tumor cells. Panels left to right = 4X, 20X, 40X of same tibia. Scale bars = 500 μM (left) and 100 μM (right two panels). (b) Histomorphometric analysis of bone volume/total volume (%BV/TV) from mice described in (a) and non-tumor-inoculated (naïve) mice (n = 10 −E2 mice, n = 8 +E2 mice). (c) Representative microCT images of mice described in (a,b). (d) micro-CT analysis of mice described in (c). (e) Representative images of immunostaining for pan-cytokeratin (PCK-26) and DAPI or H&E from mice described in (a). Immunofluorescence panels left to right = 4X, 20X, 40X of same tibia. H&E panels, left = 20X, right = 40X. Scale bars = 500 μM (far left panel) and 100 μM (right four panels). (f) Quantitation of pan-cytokeratin (PCK-26) area over total bone area from (e). (g) qPCR of whole bone homogenate from non-tumor-inoculated (naïve) mice (n = 10 −E2 mice, n = 8 + E2 mice) and MCF7-inoculated mice (n = 10 −E2 mice, n = 8 +E2 mice) for human B2M or human HPRT1 normalized to mouse Hmbs (housekeeping gene). (b,d,g) One-way ANOVA with Sidak’s multiple comparisons test, **P < 0.01 and ****P < 0.0001.

