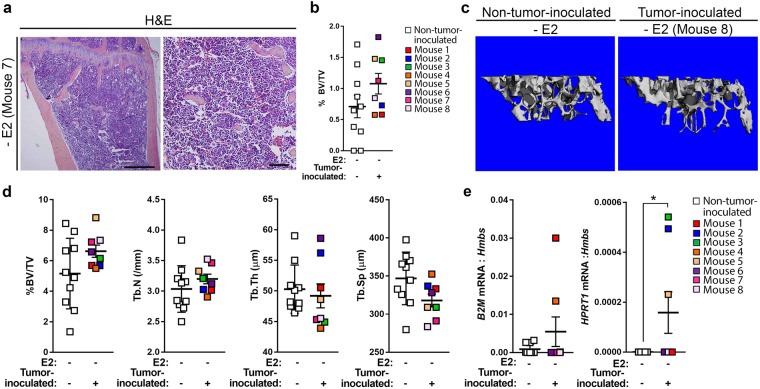
Figure 5.
Characterization of SUM159 dissemination to bone. (a) Representative H&E images of the tibia from a SUM159-inoculated mouse (n = 8 mice). Left panel = 4X, right panel = 20X of the same tibia. Scale bars = 500 μM (left panel) and 100 μM (right panel). (b) Histomorphometric analysis of bone volume/total volume (%BV/TV) from mice described in (a). (c) Representative microCT images of non-tumor-inoculated (naïve) mice (n = 10 mice) and SUM159-inoculated mice (n = 8 mice). (d) micro-CT analysis of mice described in (c). (e) qPCR of whole bone homogenate from mice described in (c) for human B2M or human HPRT1 normalized to mouse Hmbs (housekeeping gene). (e) Mann-Whitney U-test, *P < 0.05.

