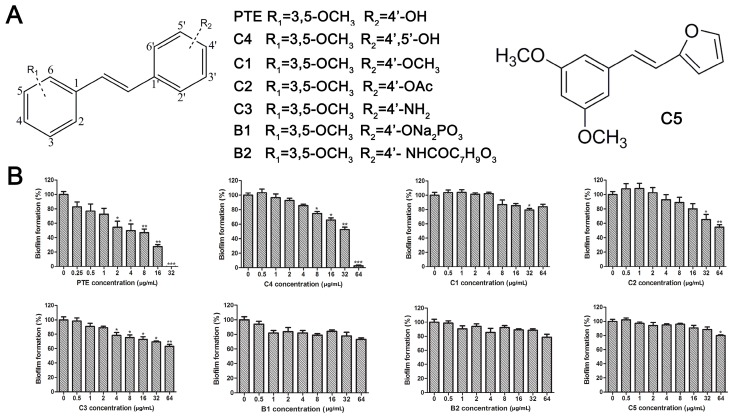
Figure 2.
Effects of PTE and analogues C1–C5, B1, B2 on biofilm formation. (A) Chemical structures of PTE and analogues C1–C5, B1, and B2 are shown. The structures of analogue C1–C5, B1, and B2 are similar with PTE, and differences only exist in partition A; (B) Biofilm formation was evaluated by XTT reduction assay, and the results were presented as the percentage compared to the control biofilms formed without compound treatment. Biofilm formation results represent the mean ± standard deviation fromthree independent experiments. * p < 0.05 compared with the control biofilms, ** p < 0.01 compared with the control biofilms, *** p < 0.001 compared with the control biofilms. Statistical analysis was performed to compare the effects of various compounds, and significant difference was observed upon all the analogues compared with PTE. p = 0.035 (C4 vs. PTE), p < 0.001 (C1 vs. PTE), p < 0.001 (C2 vs. PTE), p = 0.0047 (C3 vs. PTE), p < 0.001 (B1 vs. PTE), p < 0.001 (B2 vs. PTE), and p < 0.001 (C5 vs. PTE).

