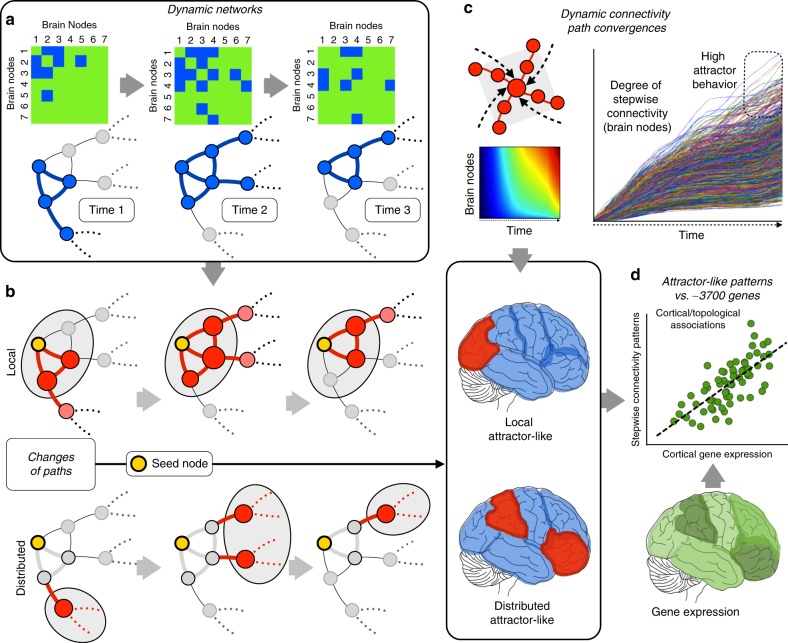
Fig. 1.
a Dynamic connectivity was evaluated using network configurations over windows of time through association matrices and graph changes. Three binary examples of time points are displayed for illustration purposes, although the real data are computed as weighted graphs. b To describe the local patterns of dynamic connectivity as well as distributed network changes outside local modules, we separately investigate the direct and indirect neighbors of all given investigated nodes in the entire cortex. As seen in the diagrams, this strategy enables the comparison of modular (or local) connectivity and distant connectivity. c SFC is used to investigate the functional streams that converge at specific points of the cortex (network phase space). Top left: diagram of converging streams in a given node. Top right and top center: calculation of the recurrence of streams targeting voxels over time at the whole-brain level (lines graph and density graph). Bottom: Due to the segregation between local and distributed networks, we can independently investigate the local and distributed recurrence connectivity. The diagrams represent the cerebral cortex and red areas with high accumulative degree of recurrent streams hitting them over time. d Local and distributed recurrence connectivity maps are compared with neuro-related genes of the human transcriptome (theoretical example shown as the green cortical map) via spatial similarity using a linear regression approach (scatterplot)

