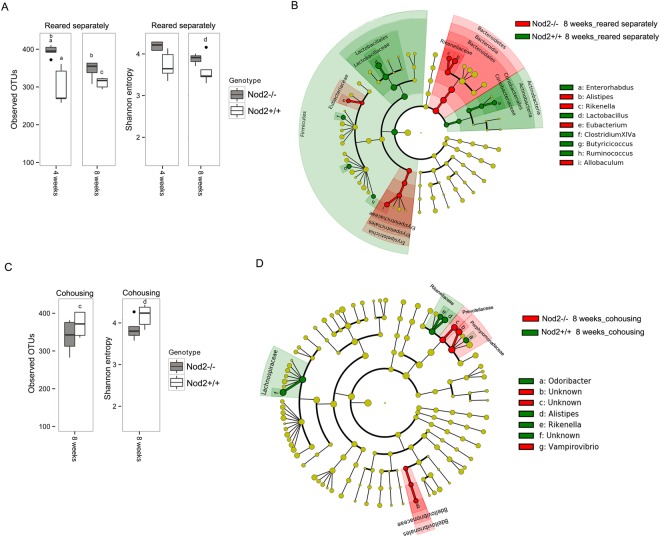
Figure 3.
Microbiota comparison between Nod2−/− and Nod2+/+ mice at 8 weeks of age in different housing conditions. (A,C) Alpha diversity measures in mice (A) reared separately and (C) in cohousing. Box plots of number of observed OTUs and Shannon entropy in Nod2−/− and Nod2+/+ mice (A) reared separately at 4 and 8 weeks of age and (C) in cohousing at 8 weeks of age. Statistically significant differences were performed by pairwise comparisons using Student t test with FDR correction. For each significant pairwise comparison p-value < 0.05 are indicated by different letters (“a”, “b”, “c”, and “d”). (B–D) Microbiota profile comparison in Nod2−/− and Nod2+/+ mice at 8 weeks (B) reared separately and (D) in cohousing. Cladogram showed the most discriminative bacterial clades identified by LEfSe analysis. Coloured regions/branches indicate differences in the bacterial population structure between Nod2−/− and Nod2+/+ mice at 8 weeks. Regions in red indicate clades that were enriched in Nod2−/− mice, while regions in green indicate clades that were enriched in Nod2+/+ mice. LEfSe results indicate a sequentially significant ranking between the two groups (Alpha value = 0.05 for the factorial Kruskal-Wallis test among classes; the threshold for the logarithmic LDA score was 2.0).

