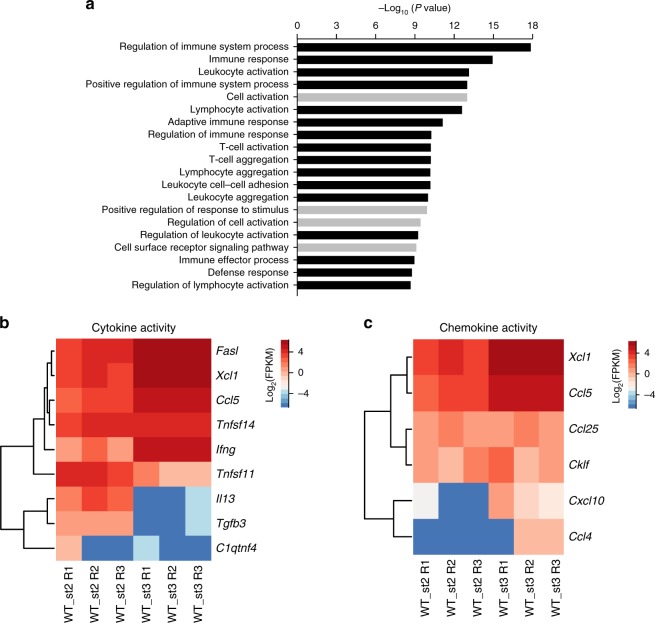
Fig. 4.
Gene expression profiles of thymic WT stage 2 and stage 3 cells. a Pathway enrichment analysis of differentially expressed genes (modified Fisher’s exact p-value < 0.05) in thymic stage 2 and stage 3 iNKT cells from WT mice (black: categories related to immune process). b Differential expression of representative genes with known cytokine activity between WT iNKT cells at stage 2 and stage 3 (fold change ≥ 2 and p-value ≤ 0.05). c Heat map of chemokine activity-related gene expression in stage 2 and stage 3 iNKT cells from WT mice. All data are combined from at least three independent experiments

