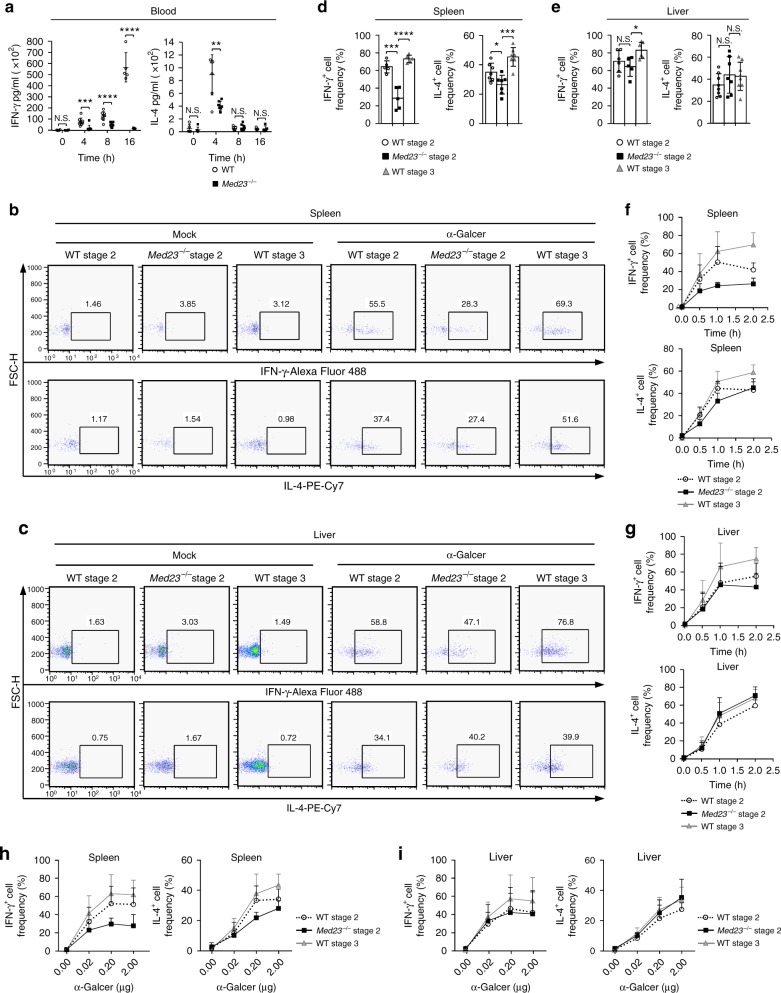
Fig. 5.
Med23 promotes cytokine secretion by iNKT cells upon their activation. a ELISA of IFN-γ and IL-4 titers in the serum of WT and Med23−/− mice at various time points (horizontal axis) after α-GalCer administration (IFN-γ, 0 h, n = 4; 4 h, n = 9; 8 h, WT, n = 8, KO, n = 9; 16 h, n = 5) (IL-4, 0 h, WT, n = 5, KO, n = 6; 4 h, n = 7; 8 h, n = 9; 16 h, n = 5). b, c Production of IFN-γ and IL-4 in WT stage 2 and stage 3 cells and Med23−/− stage 2 cells of the spleen (b) and liver (c) after in vivo stimulation for 1 h with 2 μg of α-GalCer or mock. d, e The percentage of IFN-γ+ and IL-4+ cells among WT stage 2 and stage 3 cells and Med23−/− stage 2 cells in the spleens (d) and livers (e) 1 h after the injection of α-GalCer (spleen, IFN-γ+ cell frequency, n = 5; IL-4+ cell frequency, n = 7) (liver, IFN-γ+ cell frequency, WT Stage 2 and Stage 3, n = 6, KO Stage 2, n = 5; IL-4+ cell frequency, WT Stage 2 and Stage 3, n = 8, KO Stage 2, n = 7). f, g IFN-γ and IL-4 production from WT stage 2 and stage 3 cells and Med23−/− stage 2 cells in the spleens (f) and livers (g) at various time points (horizontal axis) after the injection of α-GalCer (n = 5). h, i The percentage of IFN-γ+ and IL-4+ cells in WT stage 2 and stage 3 cells and Med23−/− stage 2 cells in the spleens (h) and livers (i) after the injection of α-GalCer at various concentrations (horizontal axis) (0.00 μg, n = 6; 0.02 μg, 0.20 μg, and 2.00 μg, n = 5). The data are presented as the mean ± s.d. For all panels: *P < 0.05; **P < 0.01; ***P < 0.001; ****P < 0.0001 by Student’s t-test; N.S. no significance. All data are representative of or combined from at least three independent experiments

