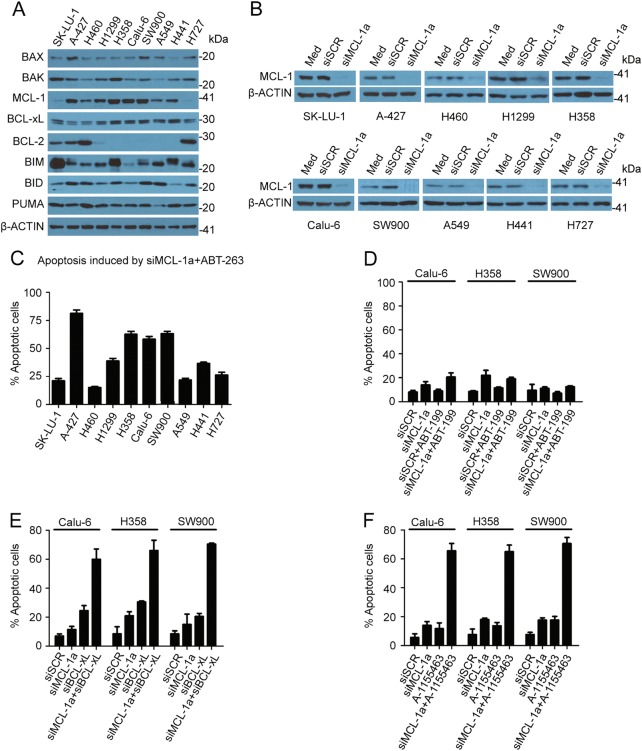
Fig. 2. Variable apoptotic response from NSCLS cells to MCL-1 and BCL-xL inhibition.
a Expression profile of BCL-2 family proteins in NSCLC cells. b Knockdown of MCL-1 expression in NSCLC cells 48 h after transfection with 25 nM siRNA oligos. siSCR: scramble siRNA; siMCL-1a: MCL-1a siRNA. c The percentage of apoptotic cells after siMCL-1a and AT-263 treatment. Cells were transfected with 25 nM siMCL-1a for 48 h and then treated with 1 μM ABT-263 for 36 h. Cell apoptosis was measured with flow cytometry. There were 3 samples in each group. d The percentage of apoptotic cells after siMCL-1a and ABT-199 treatment. Cells were transfected with 25 nM siMCL-1a or siSCR for 48 h and then treated with 1 μM ABT-199 for 36 h. Cell apoptosis was measured with flow cytometry. There were three samples in each group. e The percentage of apoptotic cells after siMCL-1a and siBCL-xL treatment. Cells were transfected with 25 nM siRNA oligos for 72 h and then analyzed for cell apoptosis with flow cytometry. There were three samples in each group. f The percentage of apoptotic cells after siMCL-1a and A-1155463 treatment. Cells were transfected with 25 nM siRNA oligos for 48 h then treated with 100 nM A-1155463 for 36 h. Cell apoptosis was measured with flow cytometry. There were three samples in each group

