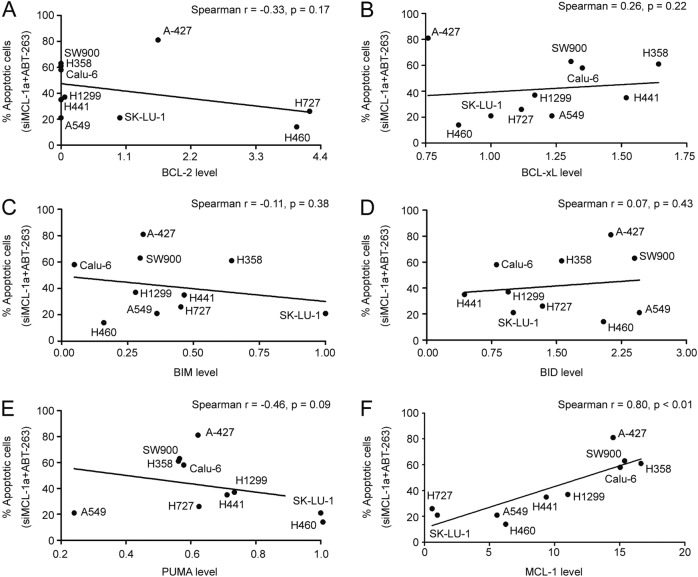
Fig. 3. MCL-1 expression level correlates with sensitivity of NSCLC to MCL-1 and BCL-xL inhibition.
Expression levels of BCL-2, BCL-xL, BIM, BID, PUMA, and MCL-1 were quantified using the Image Studio Ver 5.0 software. The level for each protein in SK-LU-1 cells was set as 1, and relative expression levels in other cells was calculated by comparing to SK-LU-1 cells. a–f The percentages of apoptotic cells induced by knockdown of MCL-1 combined with ABT-263 were plotted against relative expression levels of individual proteins in the NSCLC cells. The non-parametric one-tailed Spearman’s correlation test was applied to perform statistical analysis

