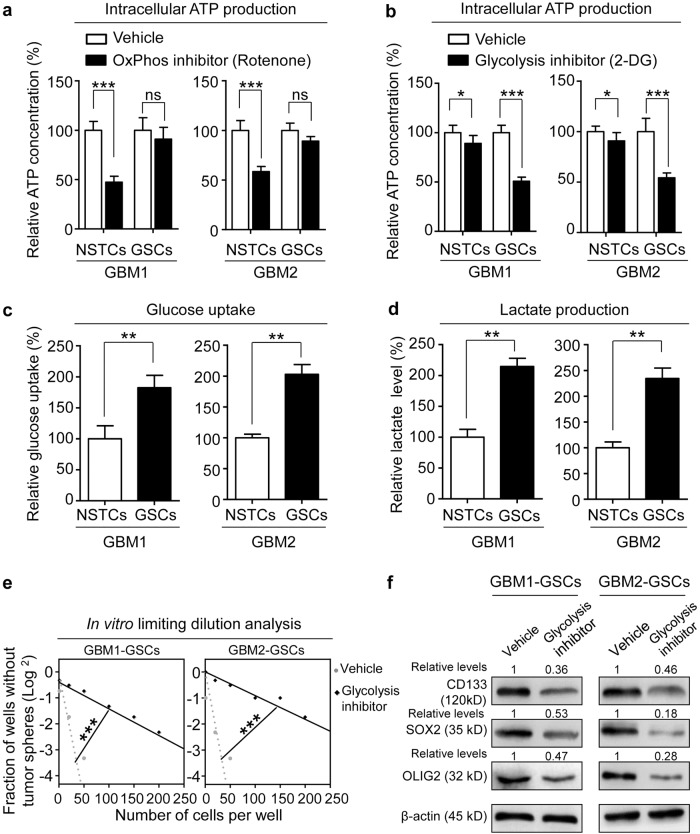
Fig. 1. GSCs are more glycolytic than NSTCs to maintain GSC phenotype.
a Measurement of the intracellular ATP concentrations in GSCs and NSTCs treated with OxPhos inhibitor rotenone or vehicle control. Disrupting OxPhos metabolism by rotenone significantly decreases ATP production in NSTCs but not in GSCs. GSCs and matched NSTCs used in this study were established from two GBM surgical specimens, which were named as GBM1 and GBM2, respectively (***p < 0.001, ns not significant). b Measurement of the intracellular ATP concentrations in GSCs and NSTCs treated with glycolysis inhibitor 2-DG or vehicle control. Disrupting glycolytic metabolism by 2-DG robustly reduces ATP production in GSCs but modestly suppresses ATP production in NSTCs (***p < 0.001, *p < 0.05). c Analysis of glucose-uptake ratio of NSTCs relative to GSCs. GSCs are more advanced to uptake glucose than NSTCs (**p < 0.01). d Analysis of the lactate production in NSTCs relative to GSCs. GSCs produce more lactate, a metabolite of glycolysis, than NSTCs (**p < 0.01). e In vitro limiting dilution analysis of GSCs treated with or without glycolysis inhibitor 2-DG. Disrupting glycolytic metabolism by 2-DG inhibits the self-renewal capacity of GSCs (***p < 0.001). f Western blot analyses of GSC markers CD133, SOX2, and OLIG2 in GSCs treated with or without glycolysis inhibitor 2-DG. Expressions of CD133, SOX2, and OLIG2 are decreased in GSCs treated with 2-DG

