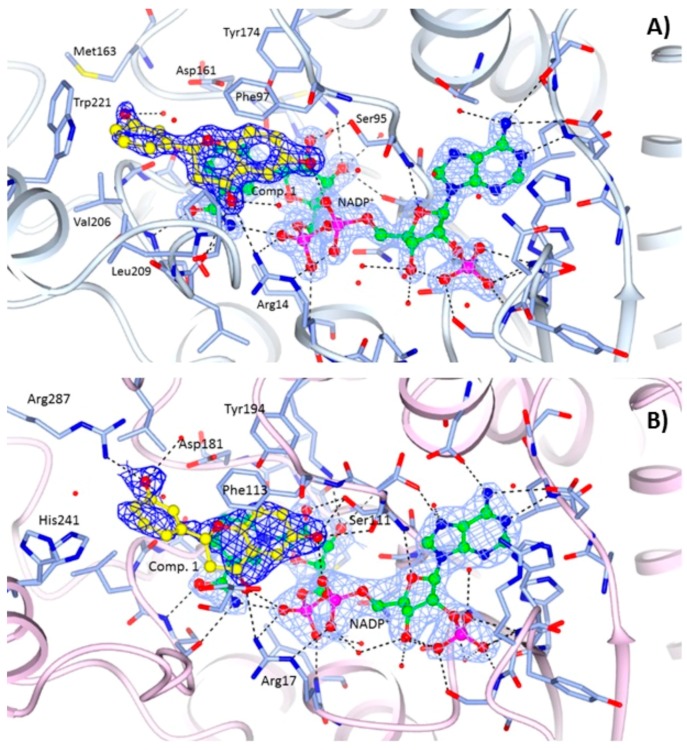
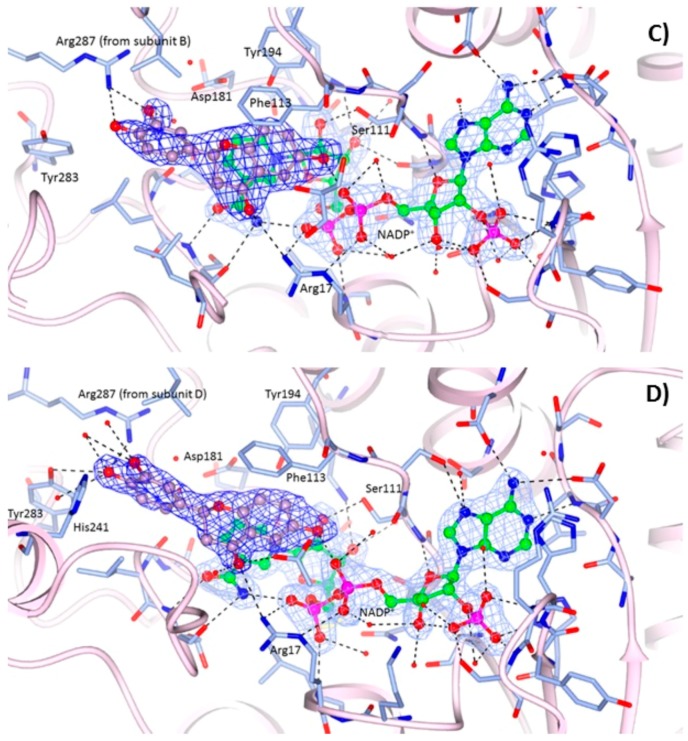
Figure 3.
Binding of the NADP+ cofactor (ball and sticks, green carbon atoms) and compounds 1 (ball and sticks, yellow carbon atoms) in the active site of: (A) TbPTR1 (grey ribbons); and (B) LmPTR1 (pink ribbons). Binding of the NADP+ cofactor (ball and sticks, green carbon atoms) and compound 3 (ball and sticks, purple carbon atoms) in the active site of: (C) LmPTR1 subunit C, and (D) LmPTR1 subunit A. The 2Fo−Fc electron density maps corresponding to the inhibitors (dark-blue wire) and NADP+ (light-blue wire), contoured at the 1σ level, are shown. H-bonds involving the cofactor and inhibitor are shown as dashed lines. It is worth noting the different orientation and environment of the compound 3 catechol ring between subunits C and A of LmPTR1.


